
Arrow Ring Chart
In stock
$5.00
item details (8 Editable Slides)
- Applications Supported: PowerPoint, Google Slides
- File Type: .pptx, Google Slides
- Aspect Ratio:16:9 (Wide Screen)
- Animation: Yes
Arrow Ring Chart
Arrow Ring Chart
(8 Editable Slides)
Related Products
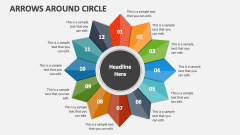
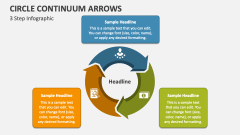
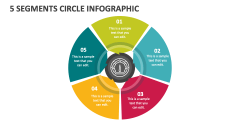
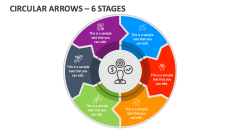
Lay your hands on our multipurpose Arrow Ring Chart presentation template for MS PowerPoint and Google Slides to demonstrate the cyclical or continuous processes, interconnected elements or components, software development stages, and more. The sample text placeholders will help you input relevant content easily.
Project heads can utilize this feature-rich set to illustrate different stages of a project and the sequential workflow of activities in a visually appealing manner. Business leaders can showcase the workflow of core business functions, decision-making processes, iterative improvements in a plan, and more. Product managers can highlight the product development phases, feature iterations, or enhancement cycles. Sales and marketing professionals can utilize these graphics to portray lead nurturing processes and conversion paths effectively.