A Well-Curated Gallery of PowerPoint Data-Driven Charts
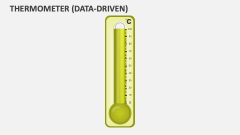
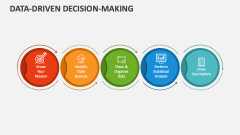
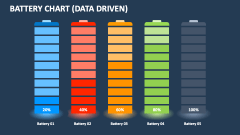
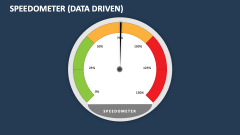
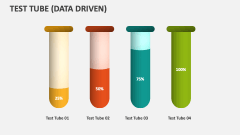
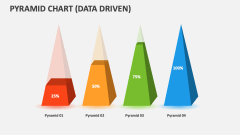
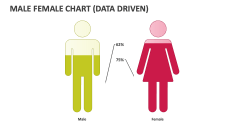
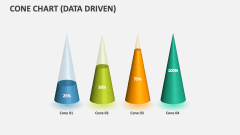
Our fine collection of layouts and designs serves the presenter's requirements perfectly. From RAG dashboards to CEO reports, project dashboards to KPI dashboards, you will find appealing slides that would serve the purpose of your presentations. These PPTs comprise pie charts, bubble charts, bar graphs, histogram charts, scatter plot charts, and many other interactive graphs that you can incorporate in your PPTs without any hassle.
Data-Driven Charts PPT Themes to Make Data Visualization Compelling
Whether you are working in business, finance, research, education, medical, or even a large corporate firm, our captivating data-driven PowerPoint charts are a must-have to spruce up your existing and future PPTs. With our beautifully-designed slides and graphical layouts, demonstrating executive summaries, financial data, revenue breakdown, and gross profit becomes very easy. You can also present the relationship between variables, feedback surveys, sampling studies, etc., with the help of our decks.
Data-Driven Charts PowerPoint Designs without Any Copyright Issues
When you are working with our data-driven chart slides to beautify your presentations, you don't have to be concerned about any copyright infringement issues. We create our designs from scratch; therefore, the presenter can use the slides infinite times after downloading them once. The graphs and charts in our templates are linked to excel. The excel will pop up when you right click on the graph/chart where you can add your data. The graph will automatically adjust according to the inserted data. You can also change the color combination of the charts to accentuate the most important data.
