
BI and Data Analytics
In stock
$5.00
item details (8 Editable Slides)
- Applications Supported: PowerPoint, Google Slides
- File Type: .pptx, Google Slides
- Aspect Ratio:16:9 (Wide Screen)
- Animation: Yes
BI and Data Analytics
BI and Data Analytics
(8 Editable Slides)
Related Products

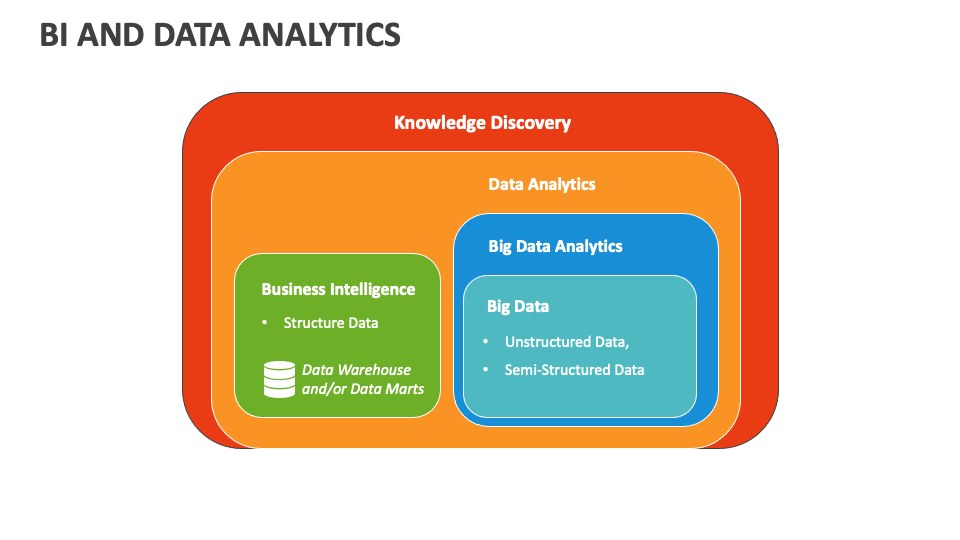
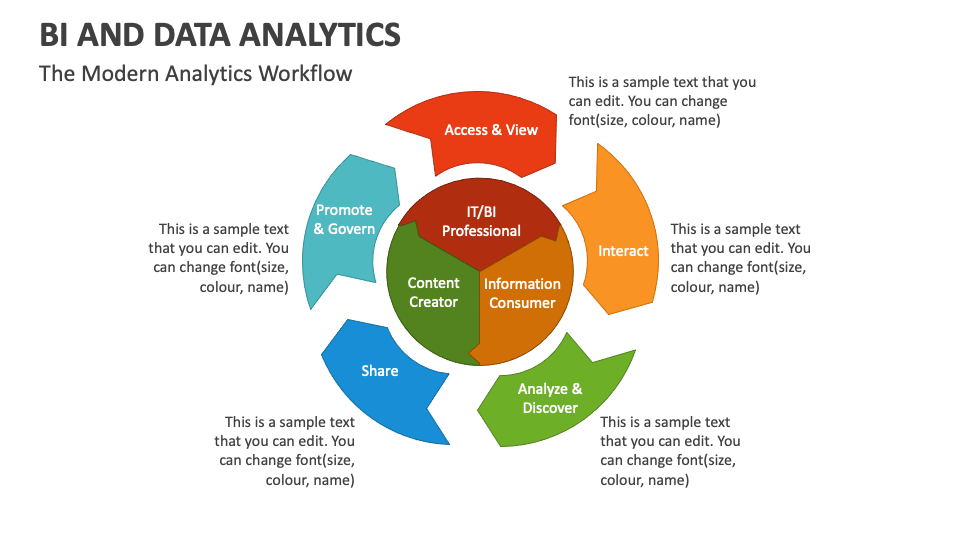
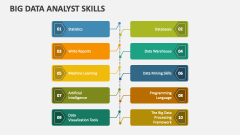
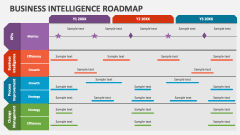
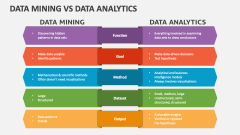
Leverage this BI and Data Analytics presentation template for MS PowerPoint and Google Slides to shed light on the focus areas and benefits of these two methodologies. You can also visualize how they help gain insights into trends and patterns.
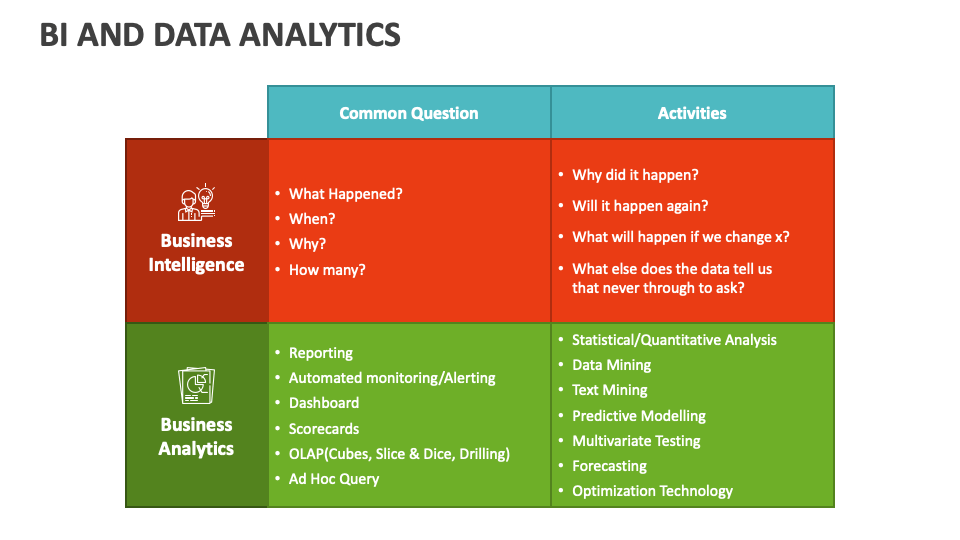
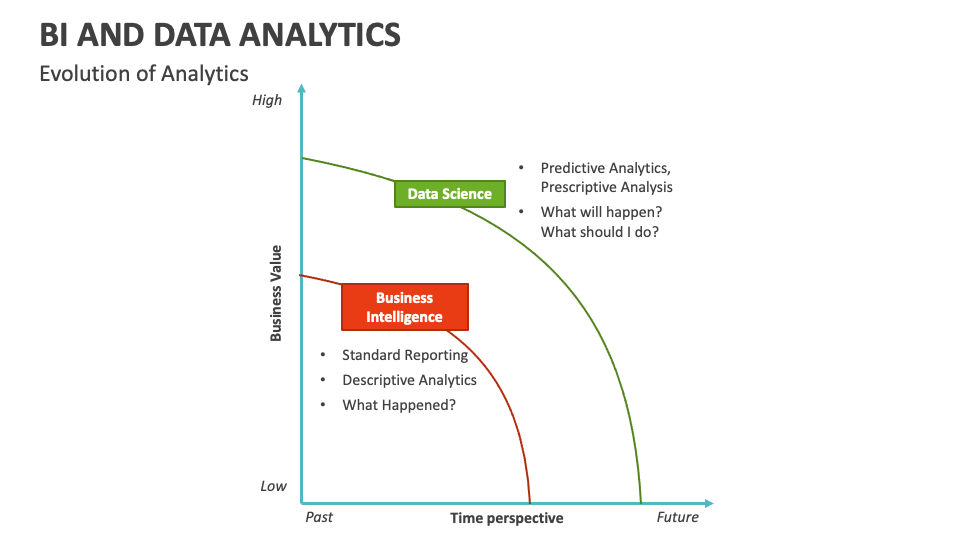
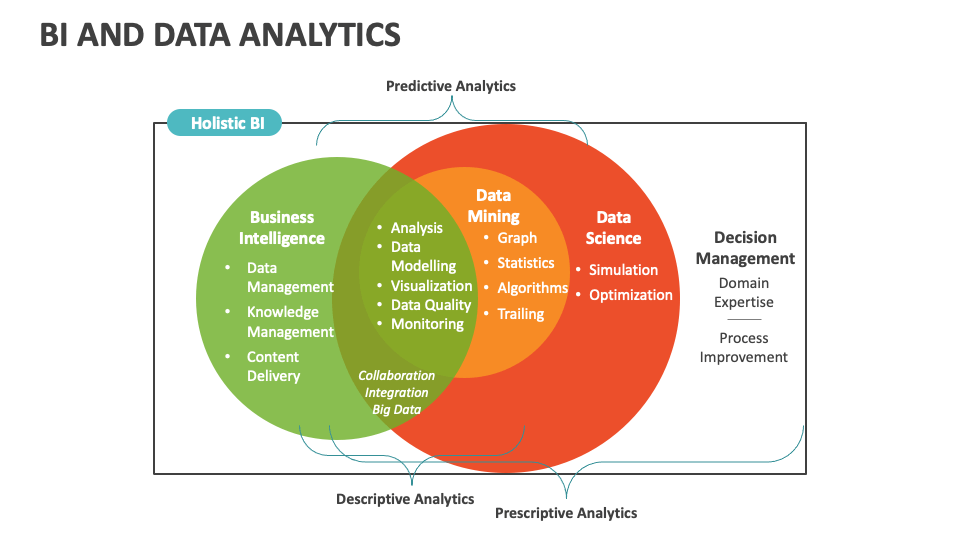
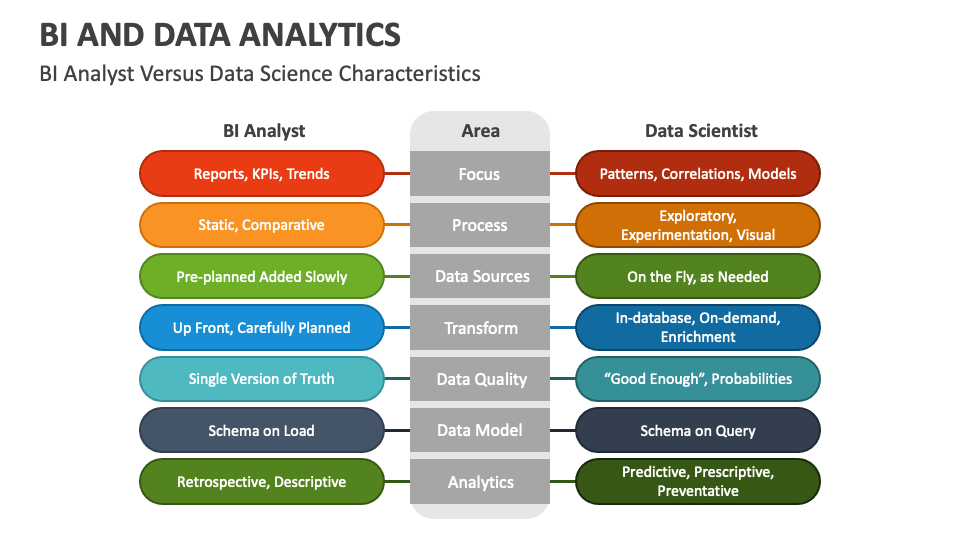
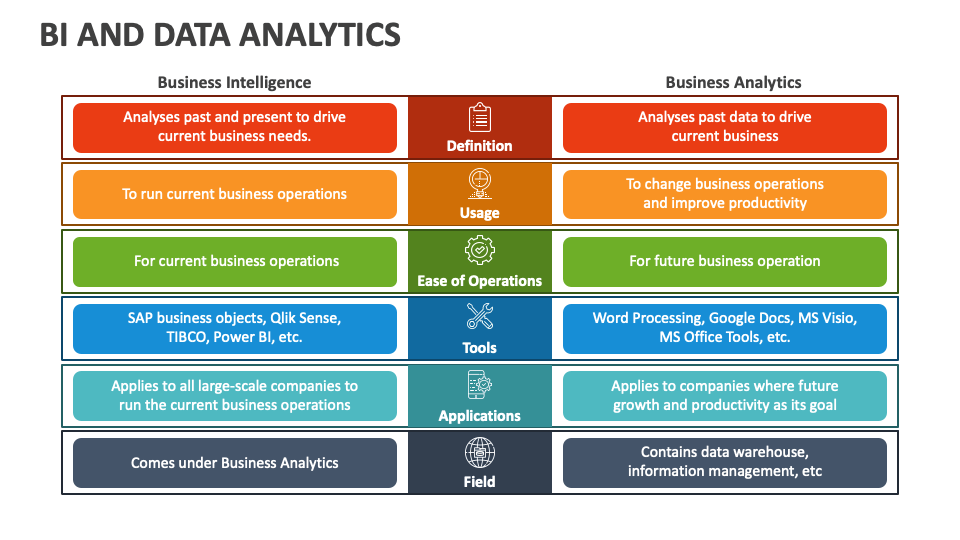
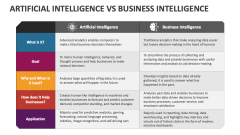
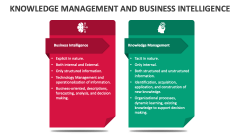
Business professionals, IT heads, data scientists, and analysts will find this PPT helpful in visualizing the modern analytics workflow in an aesthetically pleasing manner. Career counselors and HR professionals can highlight the difference between BI analysts and data scientists based on factors like focus, process, data source, etc. You can also explain how BI differs from business analytics in terms of Definition, Usage, Ease of Operations, Tools, Applications, and Field.