
Box Whisker Plot
In stock
$5.00
item details (3 Editable Slides)
- Applications Supported: PowerPoint, Google Slides
- File Type: .pptx, Google Slides
- Aspect Ratio:16:9 (Wide Screen)
- Animation: Yes
Box Whisker Plot
Box Whisker Plot
(3 Editable Slides)
Related Products
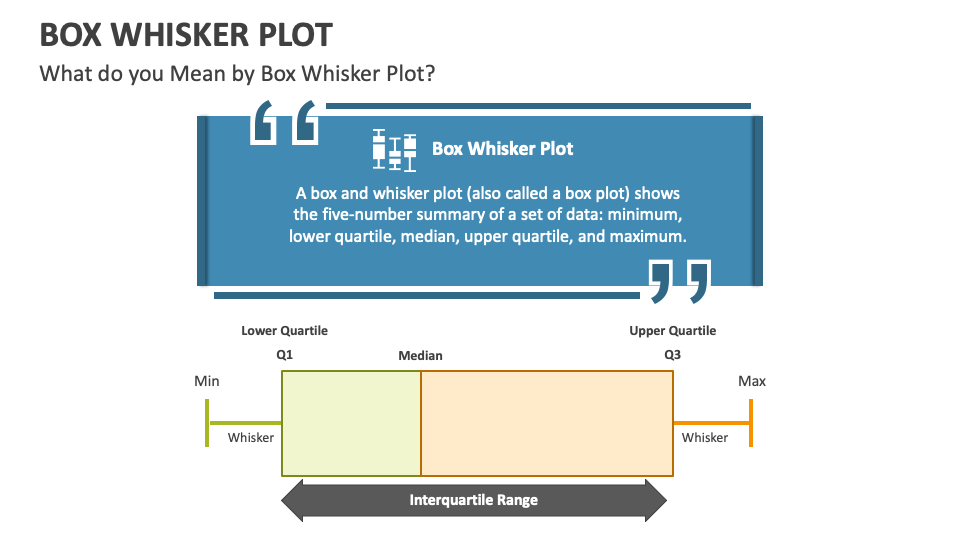
Download our intriguing, high-quality Box Whisker Plot PowerPoint template to depict the chart that provides a graphical representation of the dataset distribution at a glance. Use these slides' contemporary and graphically superior visuals to make your content stand out.
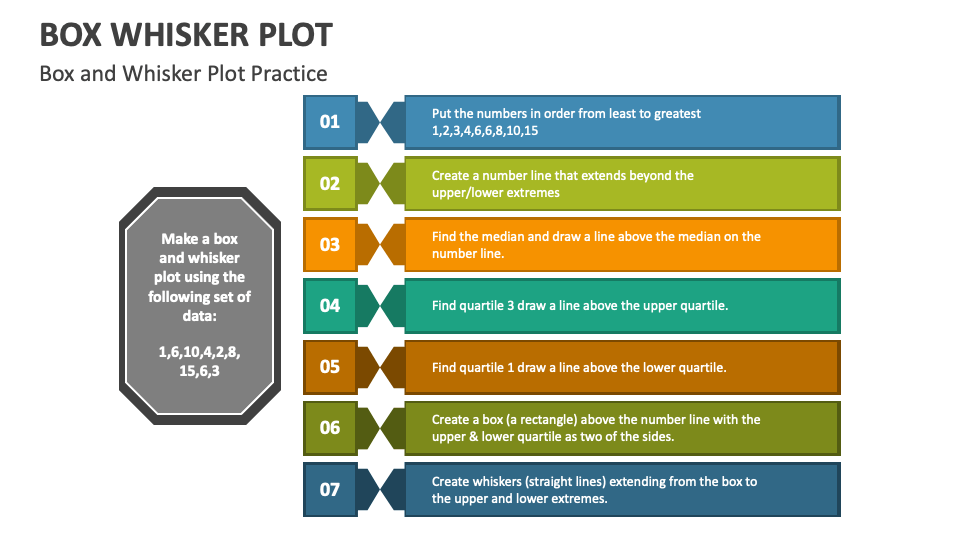
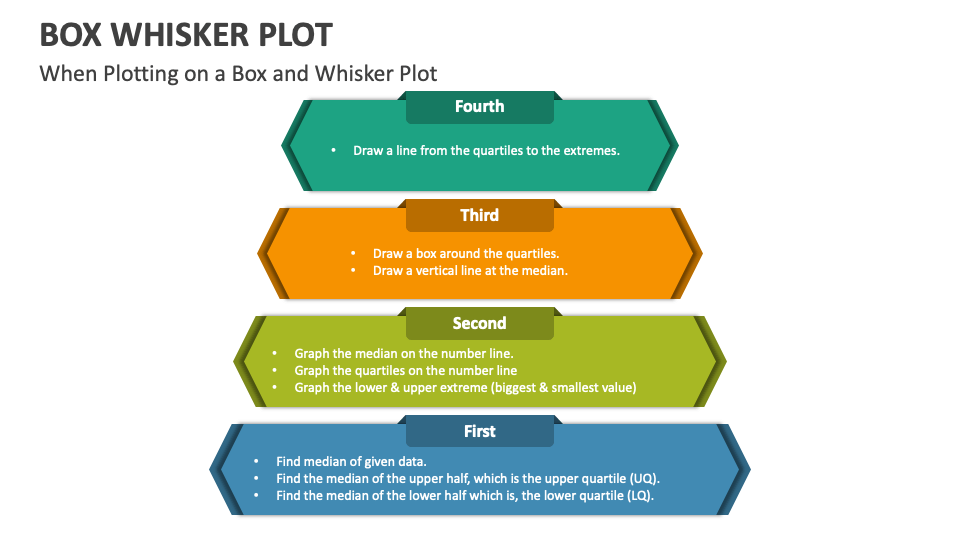
Business intelligence analysts, data scientists, and analysts can utilize these impressive PowerPoint slides to explain the step-by-step approach to drawing a box whisker plot. You can also use this set to explain how a box whisker plot helps summarize data from multiple sources and displays the relevant results in a single graph.