
Build Measure Learn Cycle
In stock
$5.00
item details (5 Editable Slides)
- Applications Supported: PowerPoint, Google Slides
- File Type: .pptx, Google Slides
- Aspect Ratio:16:9 (Wide Screen)
- Animation: Yes
Build Measure Learn Cycle
Build Measure Learn Cycle
(5 Editable Slides)
Related Products
Do you want to portray the gathered customer data and feedback analysis in a visually striking manner? Then download our Build Measure Learn Cycle PPT template right away! Using the stunning visual elements provided in our slides, you can add more comprehension and meaning to your presentations.
The PowerPoint slides in this PPT comprise eye-pleasing designs:
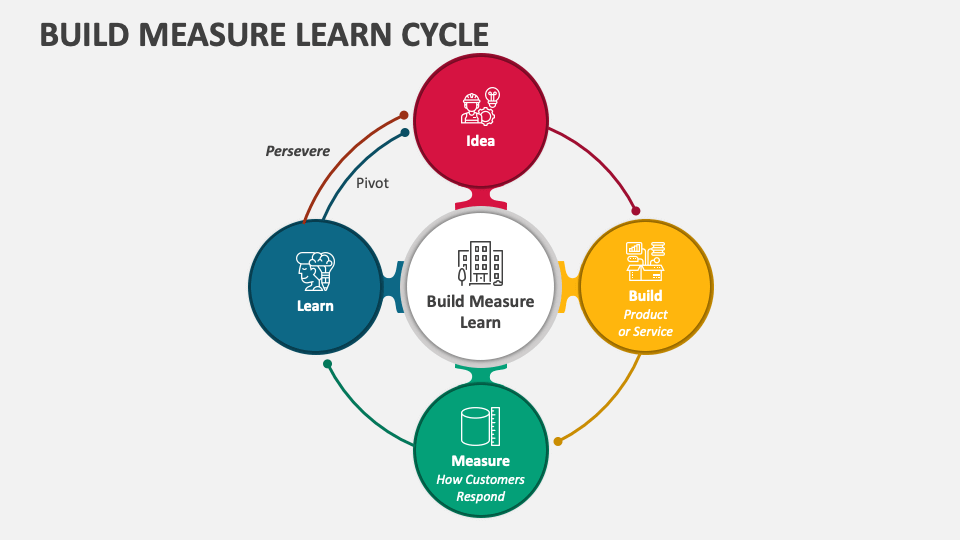
- A well-crafted diagram showcases the fundamental activities of a startup depicting whether to persevere or pivot.
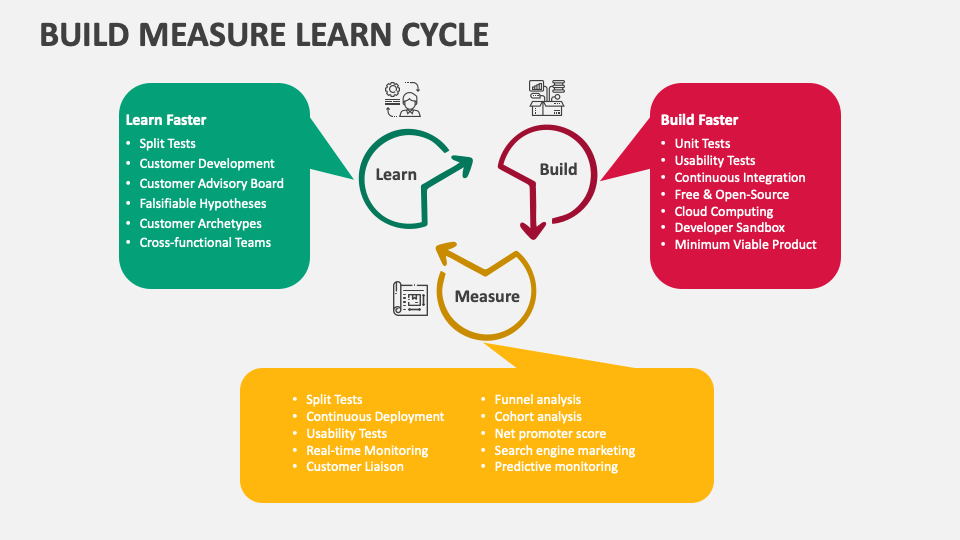
- A beautiful illustration with captivating icons showcases different techniques to be used in each phase of the cycle.
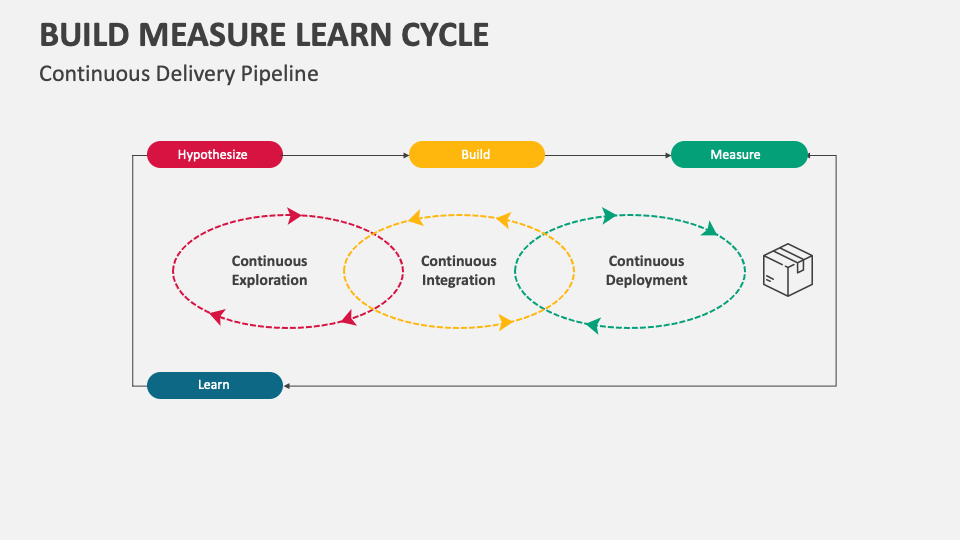
- The continuous delivery pipeline is depicted through a precisely crafted diagram.
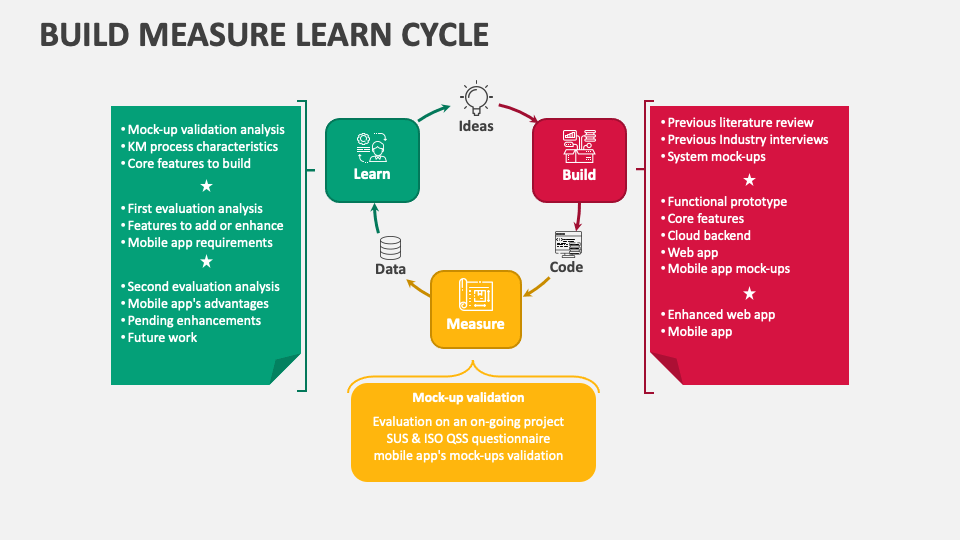
- An infographic embellished with relevant icons represents the mock-up validations of the learning, build, and measure cycle.
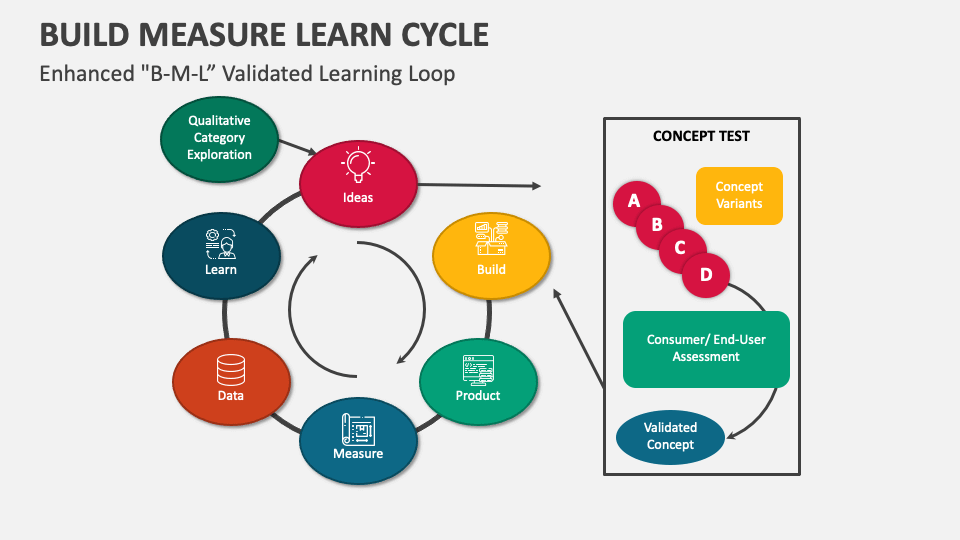
- An engaging diagram portrays the enhanced BML validated learning loop.
Professionals from different backgrounds, industries, and domains can leverage this deck to showcase the process of creating hypotheses, testing its impact by measuring the customers’ reactions, and drawing conclusions to enhance learning. Using this set, business analysts can depict foolproof ways to improve the effectiveness of new services, products, and ideas rapidly and affordably.