
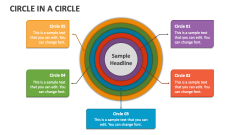
Circle Diagram
In stock
$5.00
item details (19 Editable Slides)
- Applications Supported: PowerPoint, Google Slides
- File Type: .pptx, Google Slides
- Aspect Ratio:16:9 (Wide Screen)
- Animation: Yes
Circle Diagram
Circle Diagram
(19 Editable Slides)


Related Products

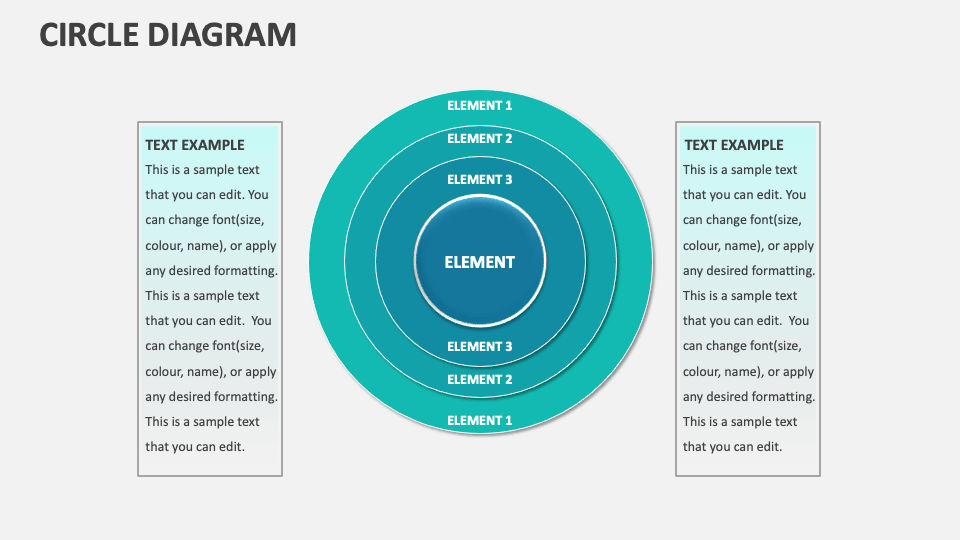
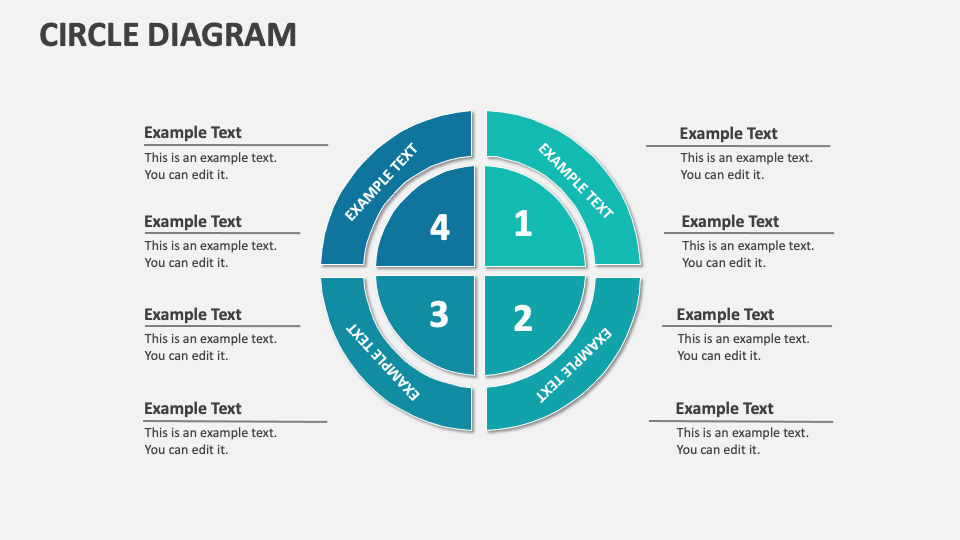
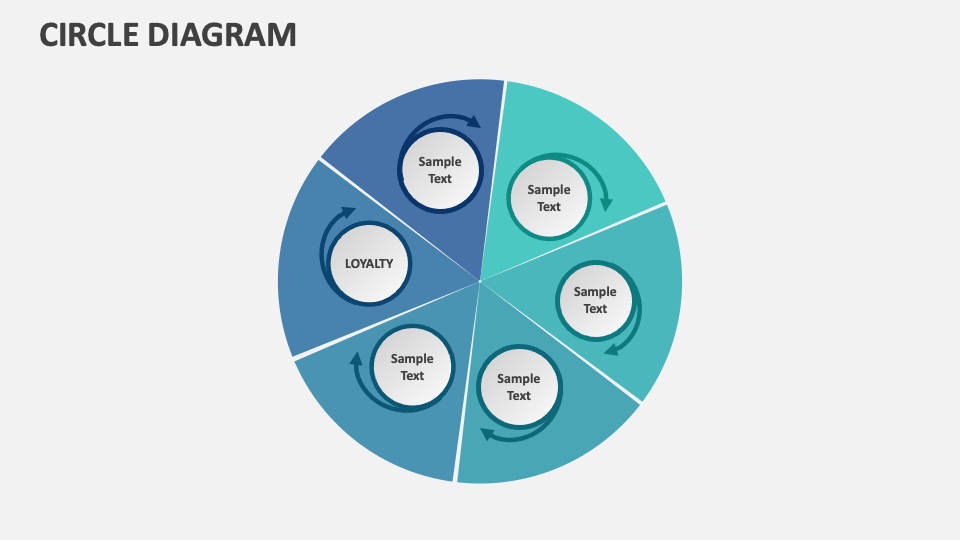
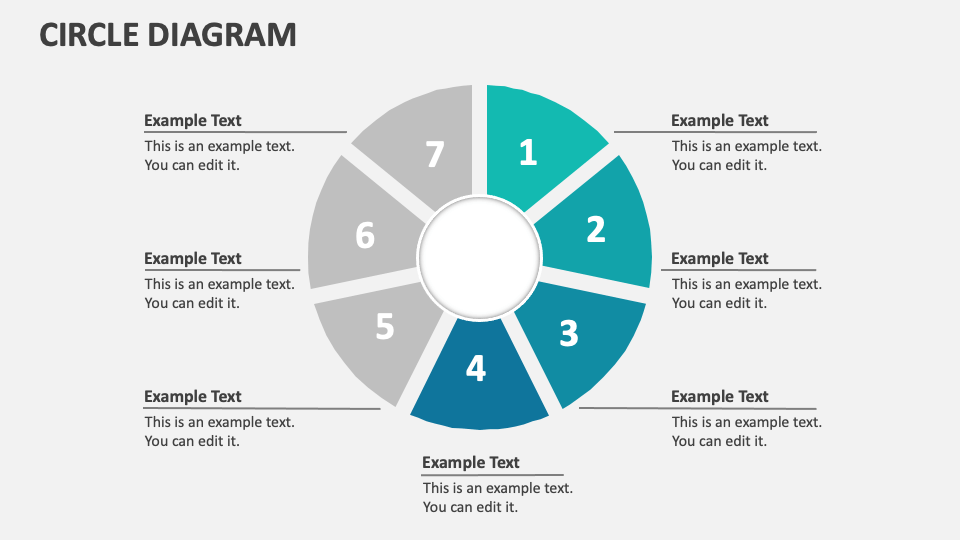
Grab our Circle Diagram for MS PowerPoint and Google Slides to deliver presentations on topics like the elements of a business plan, flow or stages of a process, fundamental components of a strategy, and more. This deck will help you illustrate the complex and large volumes of data in an organized, systematic, and easy-to-comprehend manner.
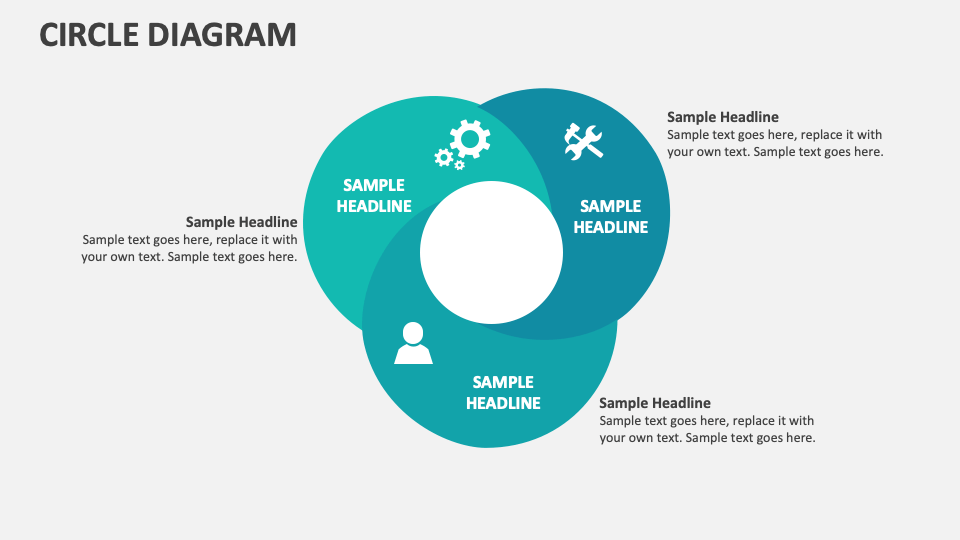
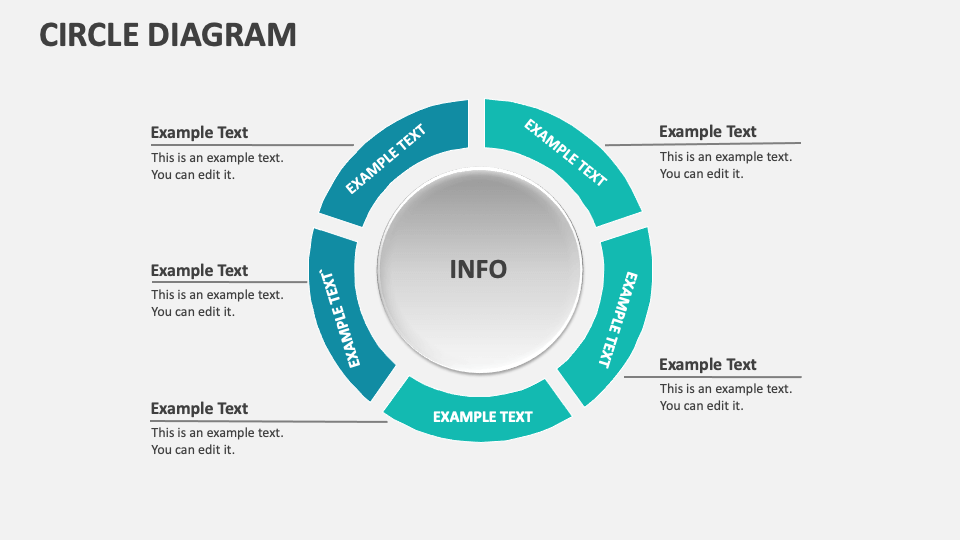
Business leaders and consultants can showcase the SWOT and PEST analysis. Sales heads can use this deck to visualize the traits and needs of different customer groups, profits generated by selling different products/services, etc. Project heads can present the stages in a project lifecycle and the key tasks of each stage. Team leaders and HR heads can use this template to demonstrate recruitment planning steps, workflow of tasks/operations, and more.