
Circle Relationship Diagram
In stock
$5.00
item details (10 Editable Slides)
- Applications Supported: PowerPoint, Google Slides
- File Type: .pptx, Google Slides
- Aspect Ratio:16:9 (Wide Screen)
- Animation: Yes
Circle Relationship Diagram
Circle Relationship Diagram
(10 Editable Slides)
Related Products

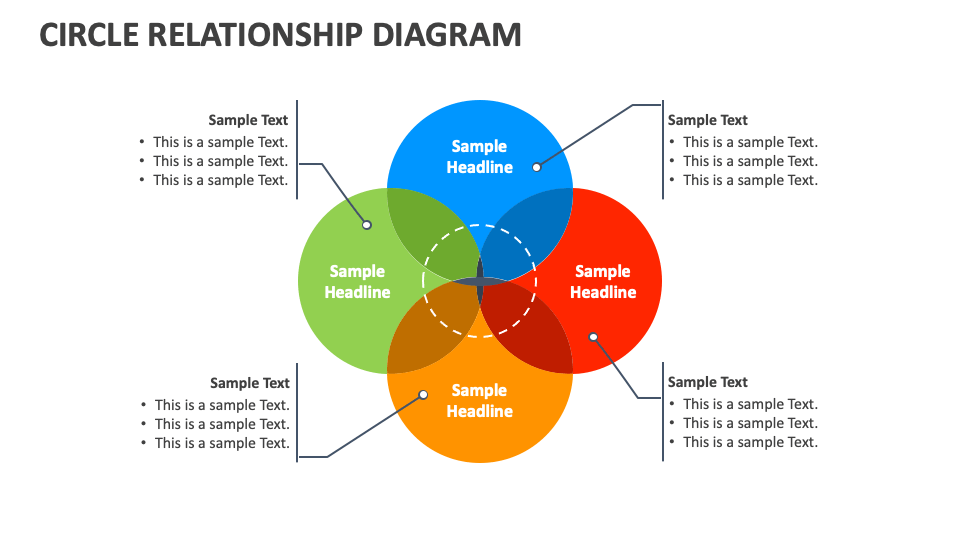
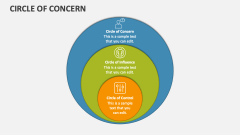
Get our Circle Relationship Diagram presentation template for MS PowerPoint and Google Slides to depict the growth stages of a business, relationships between different processes or elements, stages of the customer journey, levels of authority in a company, cause-effect relationships, and more. Don’t worry about copyright concerns with this deck, as each design element is designed from the ground up!
Business leaders can use this PPT to showcase core elements of a strategy, internal and external factors that impact a business, synergy between different teams/departments, etc. Marketing heads can illustrate the customer group segmentation strategies based on their behaviors. Project heads can demonstrate the connection between project phases. IT professionals can demonstrate the activities and components associated with a digital transformation process, and more.