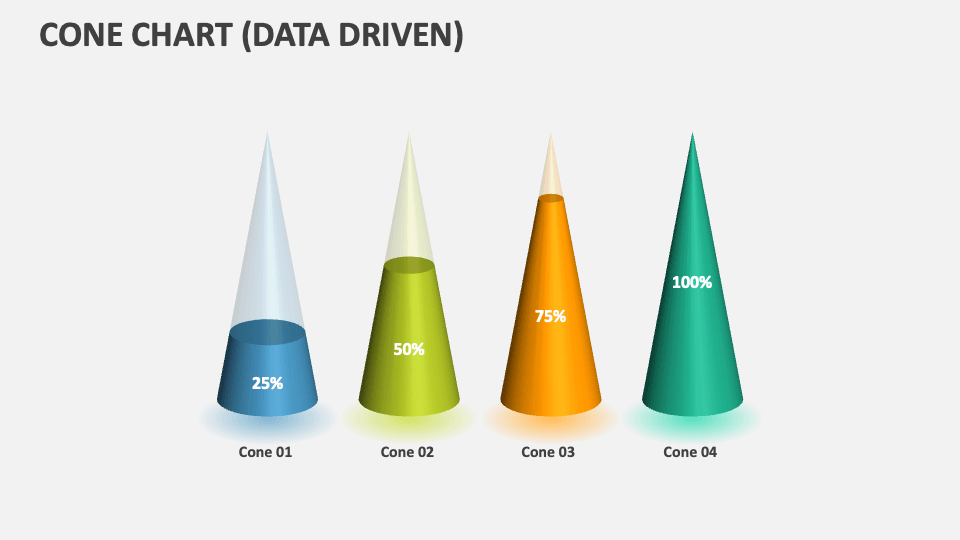
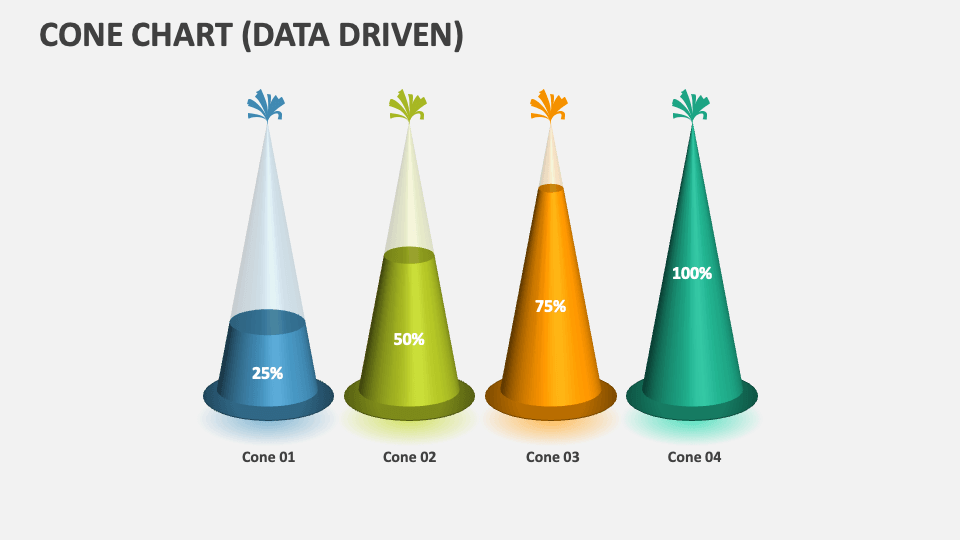
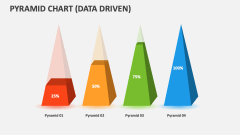
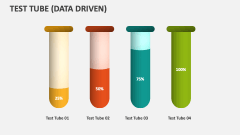
Grab our visually appealing Cone Chart Data-Driven PowerPoint template to present statistical data related to sales and marketing, lead generation, etc., in a visually stunning manner.
Business professionals can leverage these PowerPoint slides to present a comparison of revenue generation from different business units, resource management statistics, etc. Sales and marketing managers can use the deck to showcase facts and figures on market trends, customer buying behavior, lead generation rate over a period of time, etc.
