
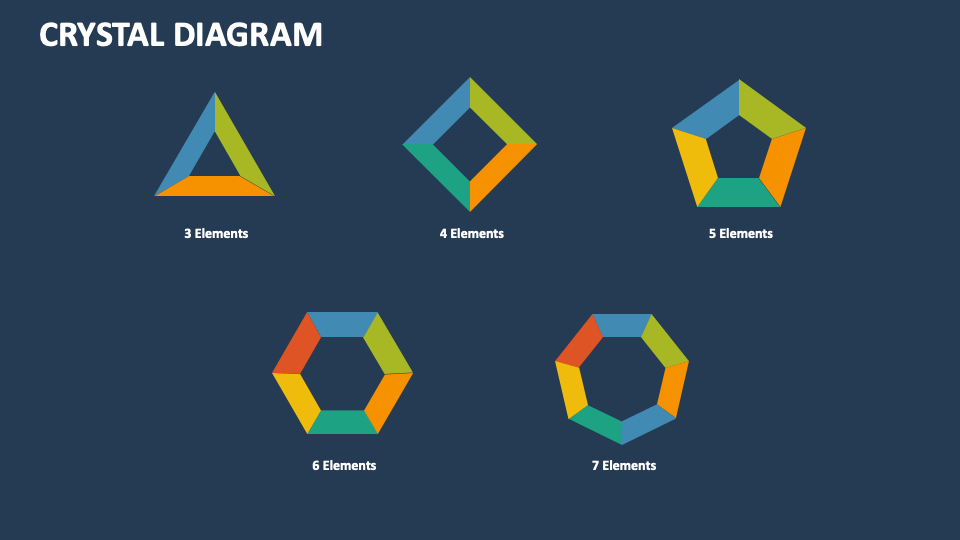
Crystal Diagram
In stock
$5.00
item details (5 Editable Slides)
- Applications Supported: PowerPoint, Google Slides
- File Type: .pptx, Google Slides
- Aspect Ratio:16:9 (Wide Screen)
- Animation: Yes
Crystal Diagram
Crystal Diagram
(5 Editable Slides)
Related Products
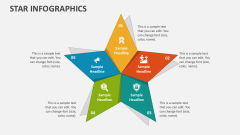
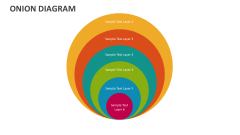
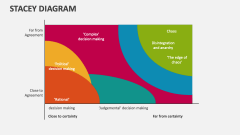
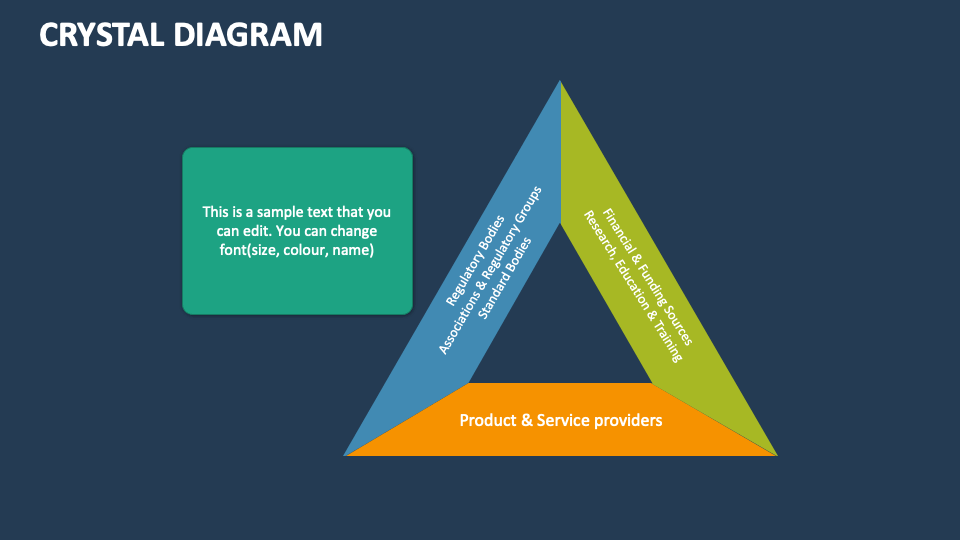
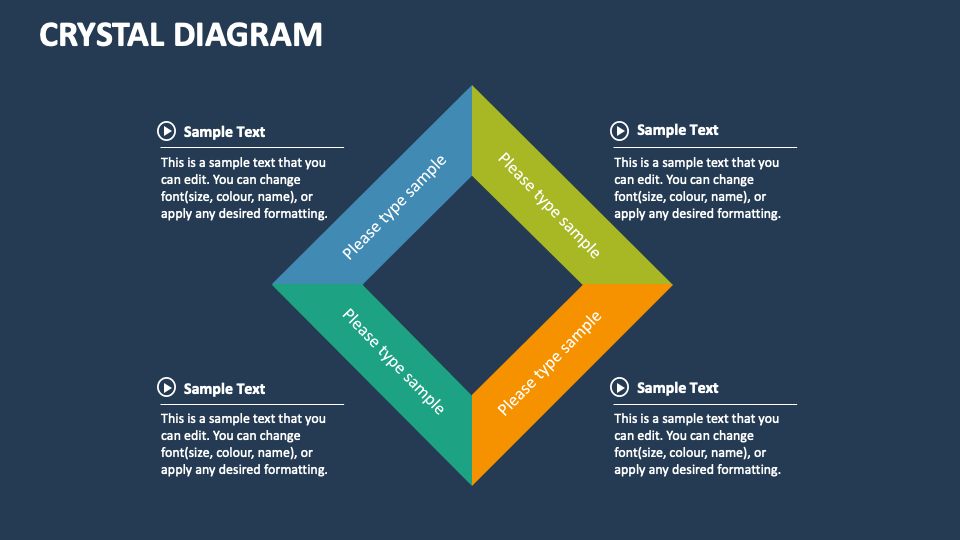
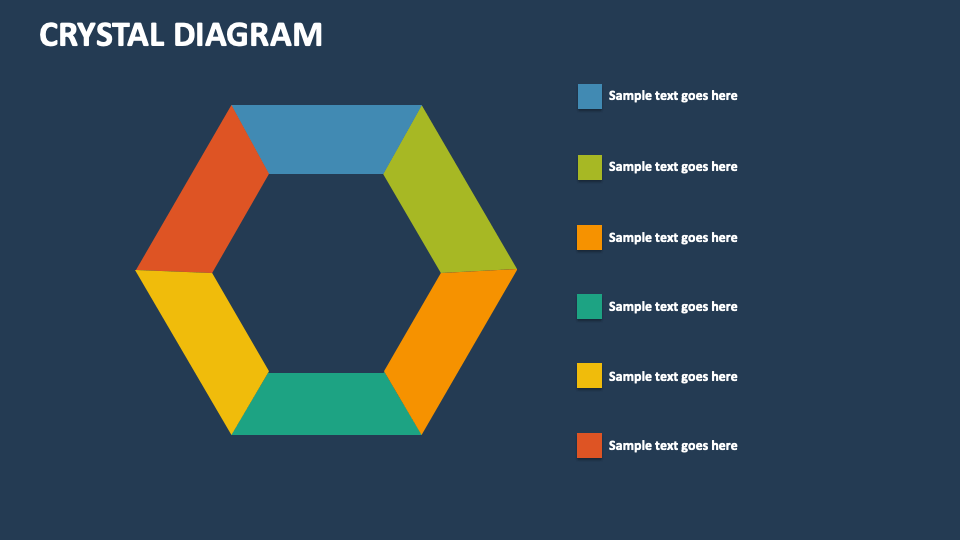
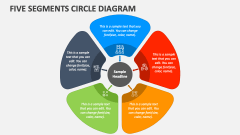
Download our Crystal Diagram for MS PowerPoint and Google Slides to visualize the phases or elements of a process, the traits of ideal employees, sequential steps performed to achieve a goal, key deliverables of a project, and more. The high-definition visual in the template will help you mesmerize the audience.
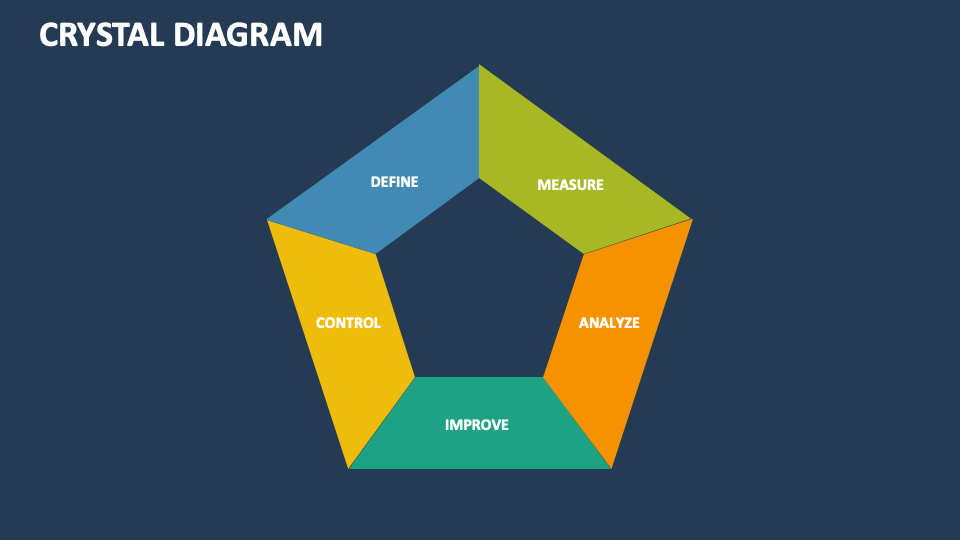
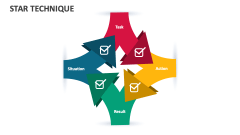
Six Sigma consultants can use this remarkable set to explain structured problem-solving DMAIC methodology used in process improvement and Six Sigma projects for achieving measurable and sustainable results. Market analysts and customer success managers can depict stages of the customer purchase journey. Product heads and quality experts can showcase the elements of the quality management framework, stepwise procedure of product development, and much more.