




Customer Service Dashboard
In stock
$5.00
item details (1 Editable Slide)
- Applications Supported: PowerPoint, Google Slides
- File Type: .pptx, Google Slides
- Aspect Ratio:16:9 (Wide Screen)
- Animation: Yes
Customer Service Dashboard
Customer Service Dashboard
(1 Editable Slide)
Related Products


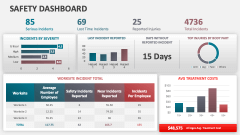
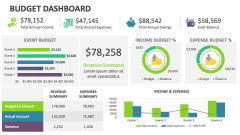
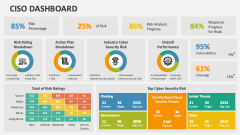

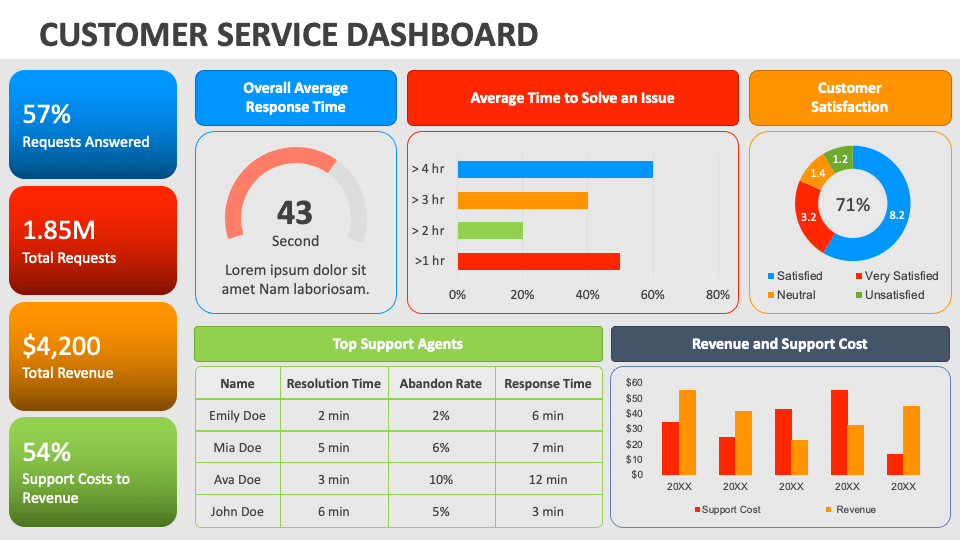
Display the performance of your customer service team in a specific week, quarter, or month using our visually stunning Customer Service Dashboard presentation slide for MS PowerPoint and Google Slides. The use of tables, bar graphs, and donut charts in the slide will make data visualization easy and engaging.
Customer service team leads can use this PPT to showcase KPIs, such as total requests, requests answered, total revenue, support costs to revenue, etc., to top management, facilitating informed decision-making and strategic changes. You can also present the top support agents of your team based on resolution time, abandonment rate, and response time. The slide is also a perfect visual aid for displaying survey results, highlighting average time to solve an issue, overall average response time, customer satisfaction score, etc.