
Decay Curve
In stock
$5.00
item details (3 Editable Slides)
- Applications Supported: PowerPoint, Google Slides
- File Type: .pptx, Google Slides
- Aspect Ratio:16:9 (Wide Screen)
- Animation: Yes
Decay Curve
Decay Curve
(3 Editable Slides)
Related Products
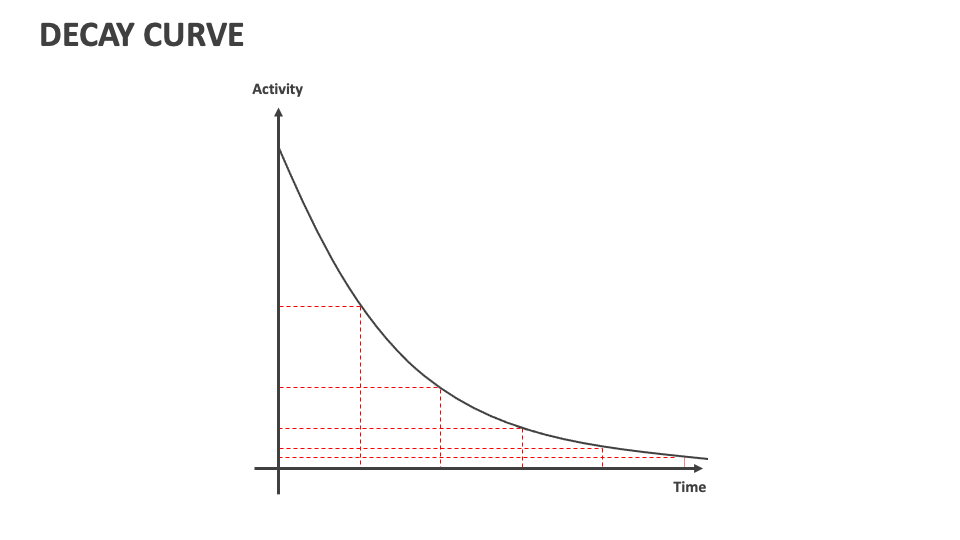
Download our readymade Decay Curve presentation template for MS PowerPoint and Google Slides to describe the gradual decline in a particular attribute or quantity over time. You can also explain how this concept is significant in various fields and helps analyze trends, predict future outcomes, and facilitate informed decisions.
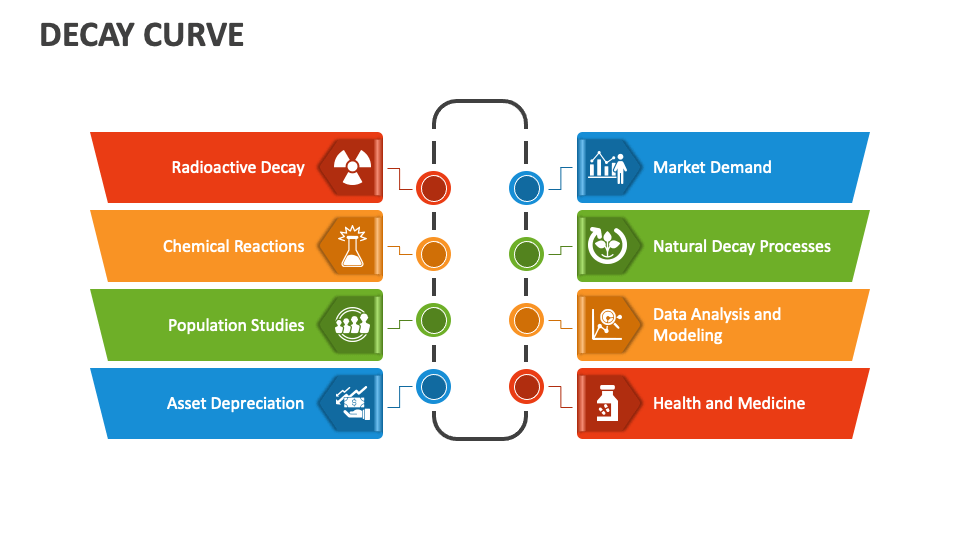
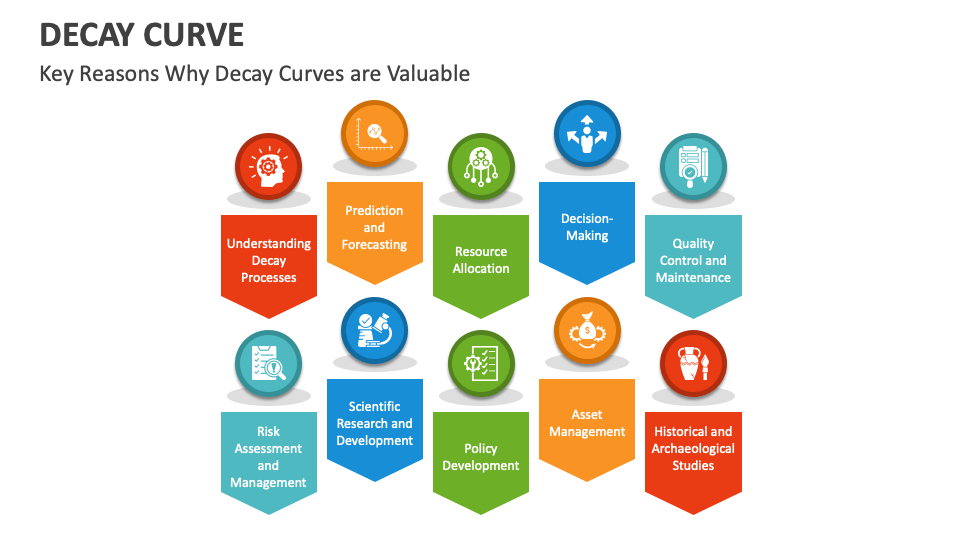
You can shed light on the applications of decay curves and key reasons that make this concept valuable and important. Software developers can make the best use of our slides to showcase the factors responsible for software components’ performance degradation. Business leaders can illustrate the role of decay curves in helping them plan inventory levels, strategize marketing efforts, and optimize resource allocation. Investment experts can use this PPT to depict asset depreciation rates and their contributing reasons.