
Donut Chart Infographic
In stock
$5.00
item details (6 Editable Slides)
- Applications Supported: PowerPoint, Google Slides
- File Type: .pptx, Google Slides
- Aspect Ratio:16:9 (Wide Screen)
- Animation: Yes
Donut Chart Infographic
Donut Chart Infographic
(6 Editable Slides)
Related Products

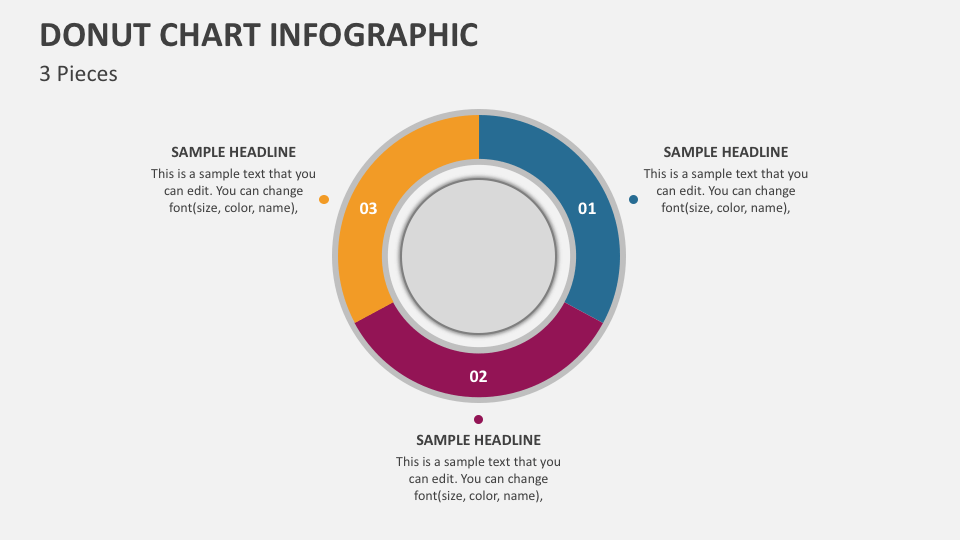
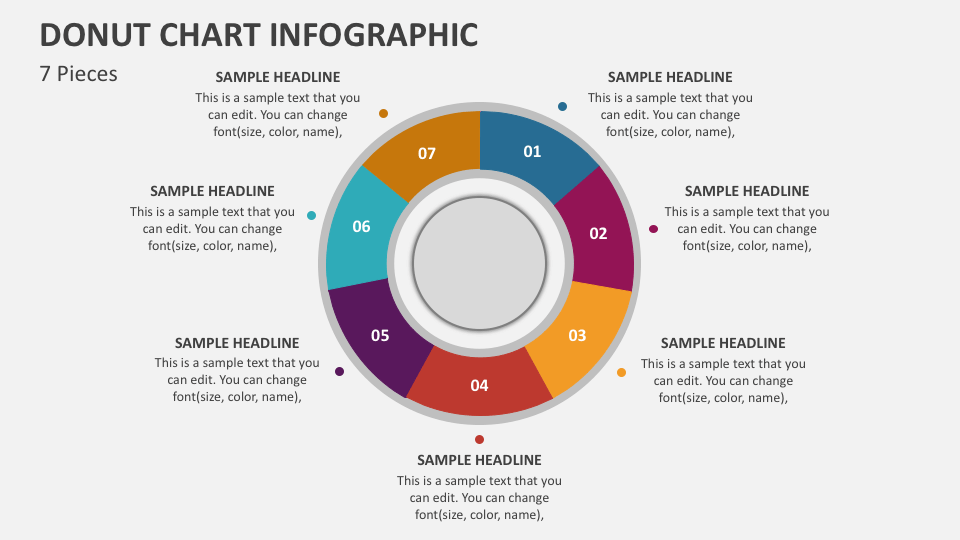
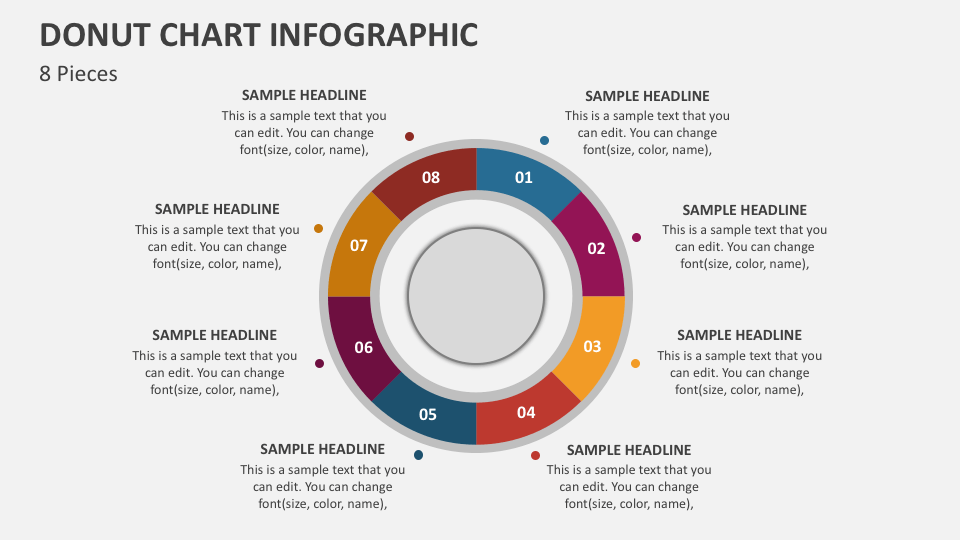
Get your hands on our feature-rich Donut Chart Infographic PowerPoint template to depict the complex statistical data in a simple and clear manner. The visually appealing slides are a perfect pick to spruce up your boring presentations!
Business analysts, senior managers, and sales/marketing professionals can leverage these PowerPoint slides to showcase the proportion of revenue from different business units. You can also use these chart infographics to illustrate project cost breakdown and represent a comparison of each team member’s contribution to the overall success of a project.