
Financial Matrix
In stock
$5.00
item details (6 Editable Slides)
- Applications Supported: PowerPoint, Google Slides
- File Type: .pptx, Google Slides
- Aspect Ratio:16:9 (Wide Screen)
- Animation: Yes
Financial Matrix
Financial Matrix
(6 Editable Slides)
Related Products

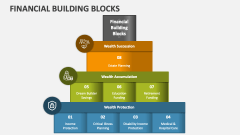
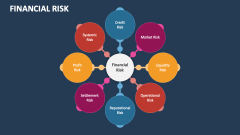
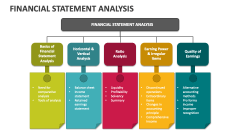
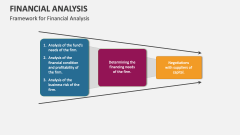
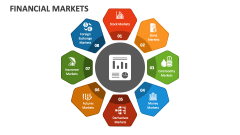
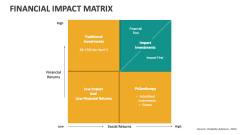
If you want to describe the tool used to analyze and compare various financial metrics across different periods or business units, download our Financial Matrix for MS PowerPoint and Google Slides. You can easily condense lengthy content into key points using these slide designs.
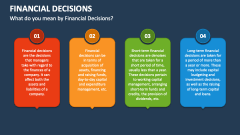
Financial experts and advisors can capitalize on this template to highlight the key indicators that help determine strong and weak investment opportunities. Investment experts can present tips and strategies for successful wealth planning, top-performing stocks, and more. You can also visualize the benefits and significance of creating an efficient investment portfolio by exploring various investment avenues.