
Fishbone Diagram
In stock
$5.00
item details (10 Editable Slides)
- Applications Supported: PowerPoint, Google Slides
- File Type: .pptx, Google Slides
- Aspect Ratio:16:9 (Wide Screen)
- Animation: Yes
Fishbone Diagram
Fishbone Diagram
(10 Editable Slides)

Related Products


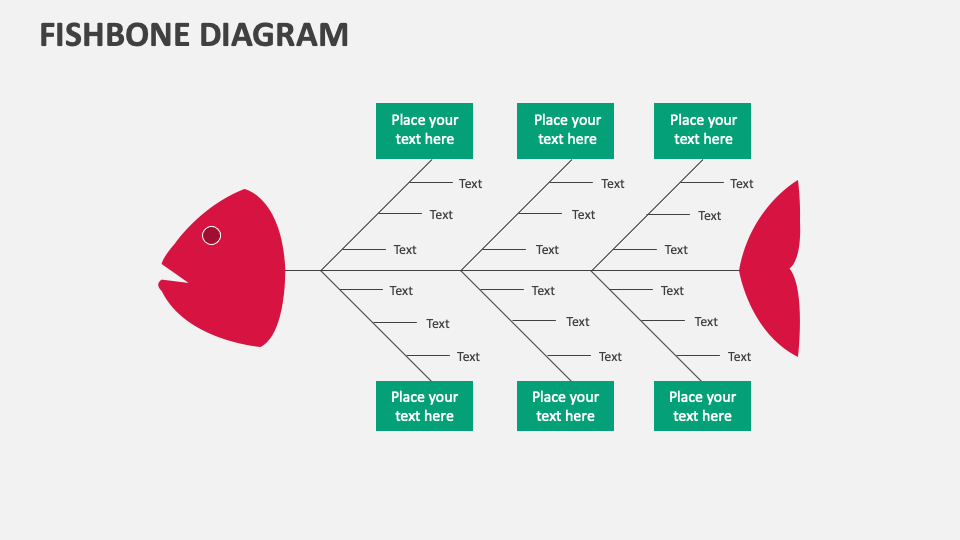
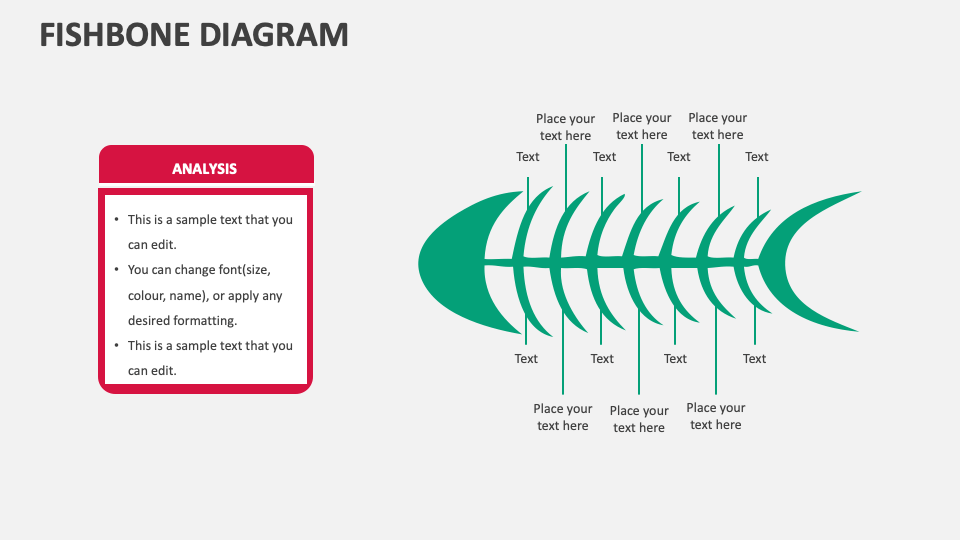
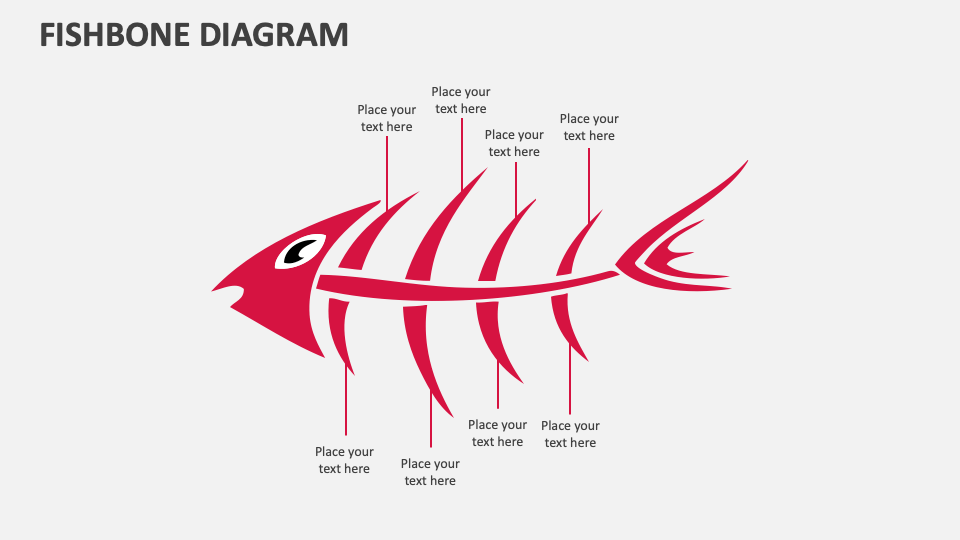
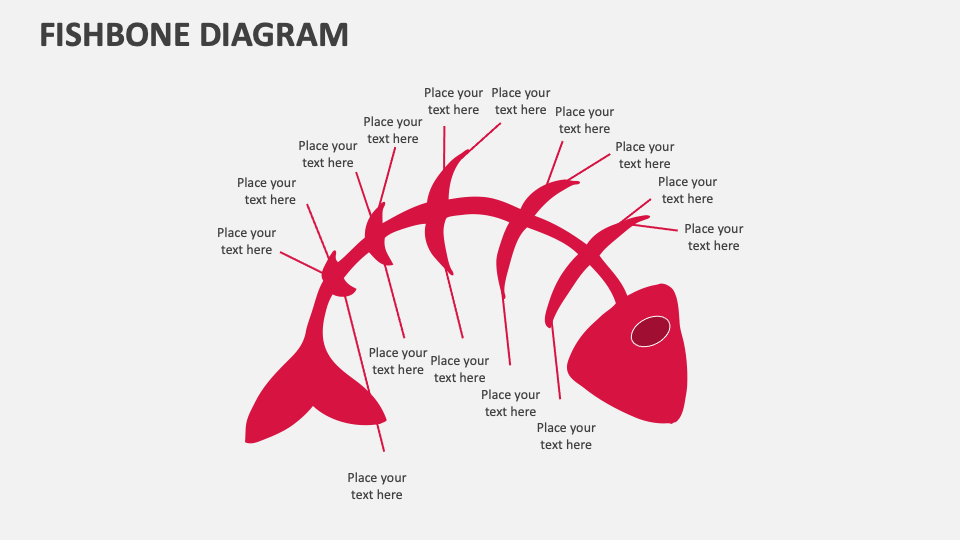
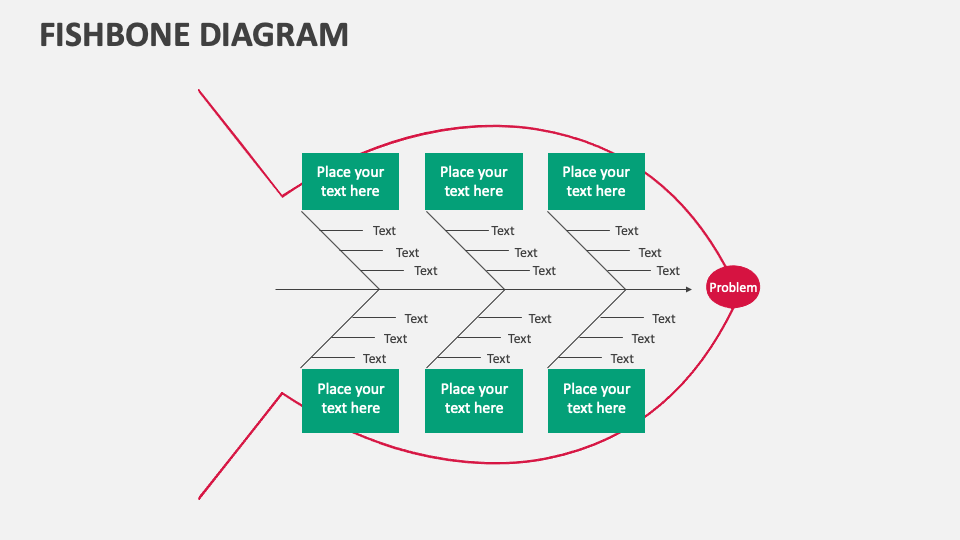
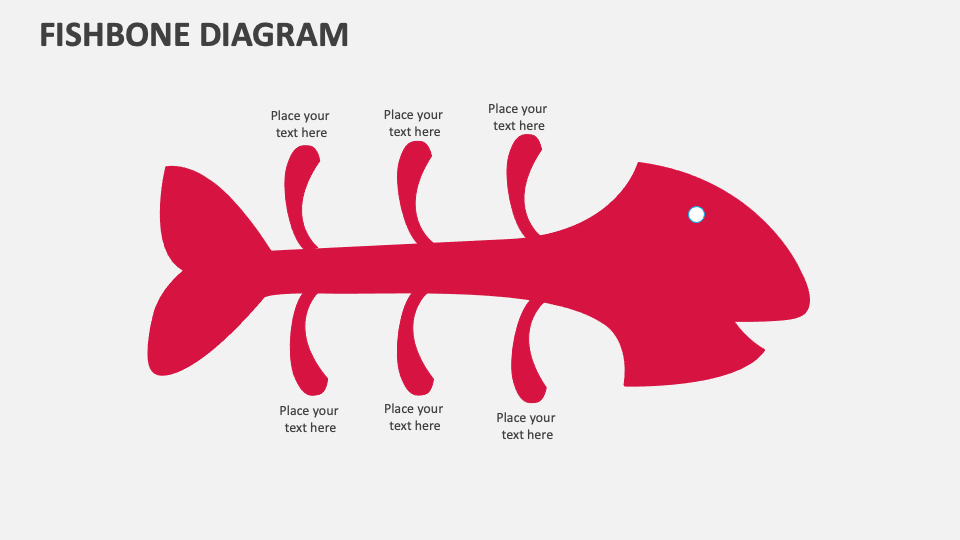
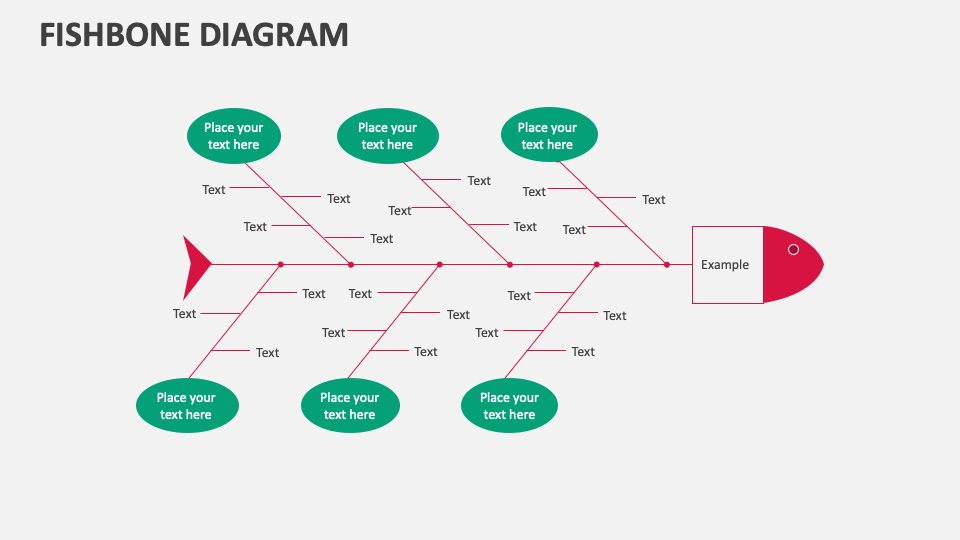
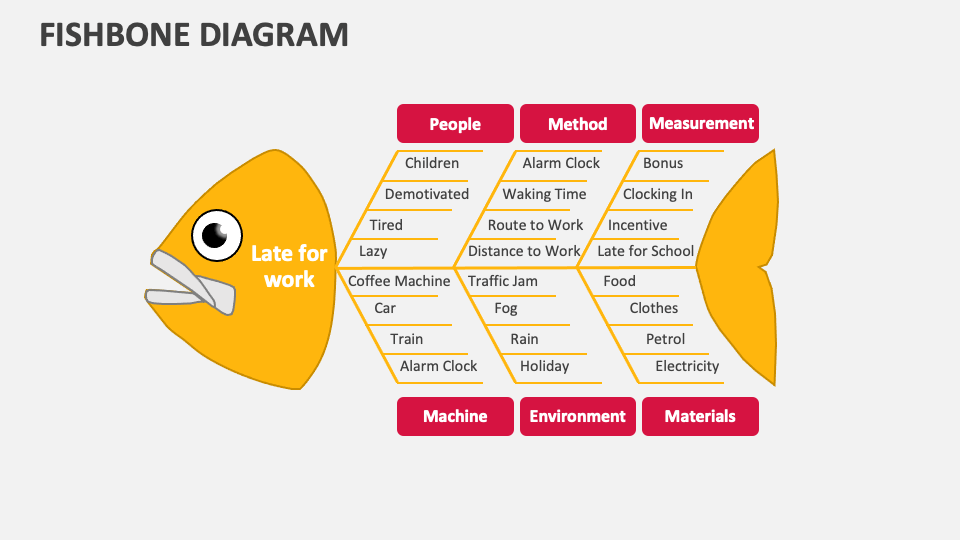
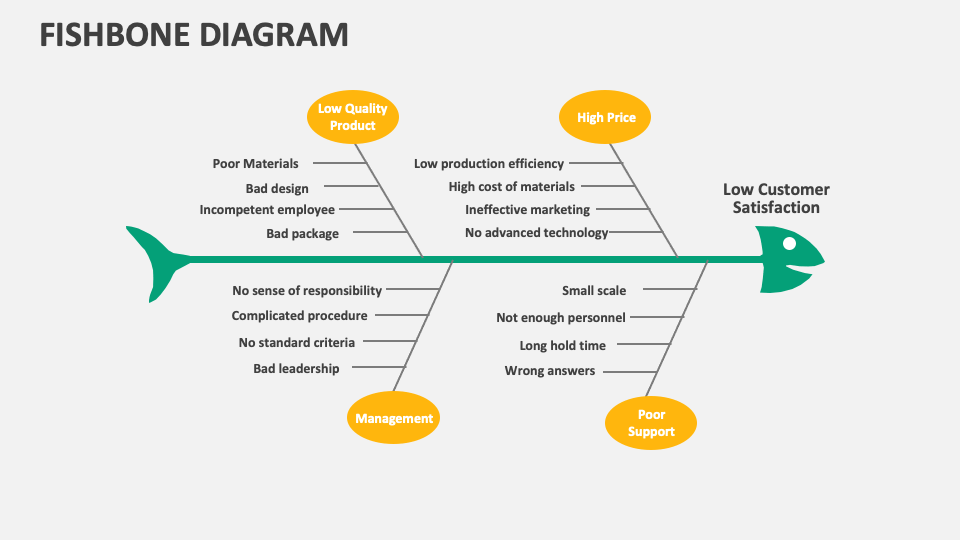
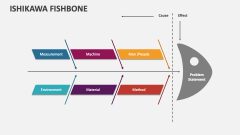
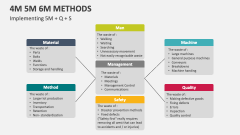
Get our Fishbone Diagram for MS PowerPoint and Google Slides to depict the visual tool used to identify and organize potential causes and effects of an event, problem, or defect. Use these professionally designed slides to leave the audience mesmerized.
Product managers and sales executives can make the most of this template to showcase the causes and consequences of poor product quality, low customer satisfaction, etc., with the help of the fishbone diagram. Team leaders can visualize the reasons for recurring issues or challenges within the team and their subsequent impacts on the team's performance and outcomes. You can further visualize the steps to draw the Ishikawa diagram.