
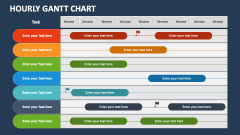
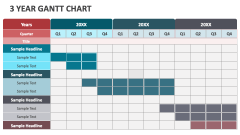
Gantt Chart
In stock
$5.00
item details (9 Editable Slides)
- Applications Supported: PowerPoint, Google Slides
- File Type: .pptx, Google Slides
- Aspect Ratio:16:9 (Wide Screen)
- Animation: Yes
Gantt Chart
Gantt Chart
(9 Editable Slides)

Related Products
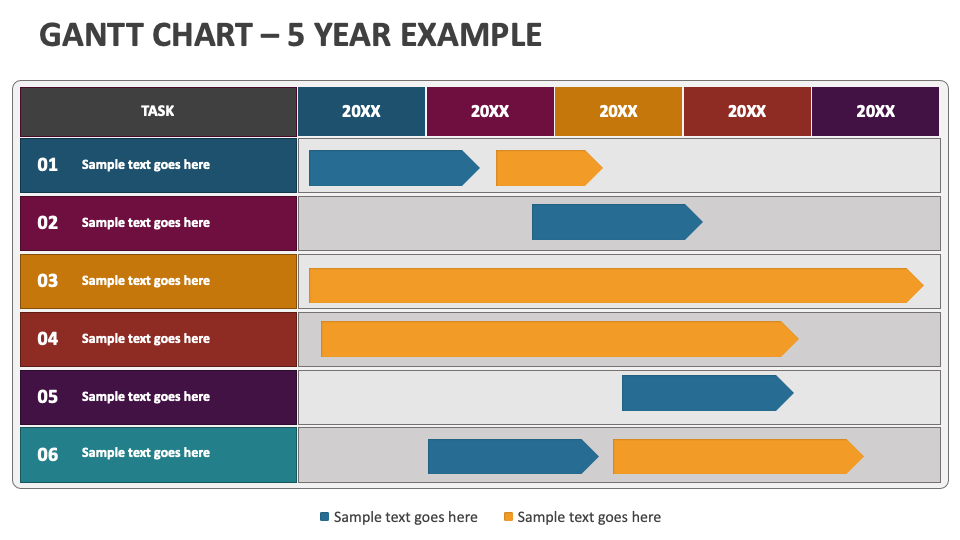
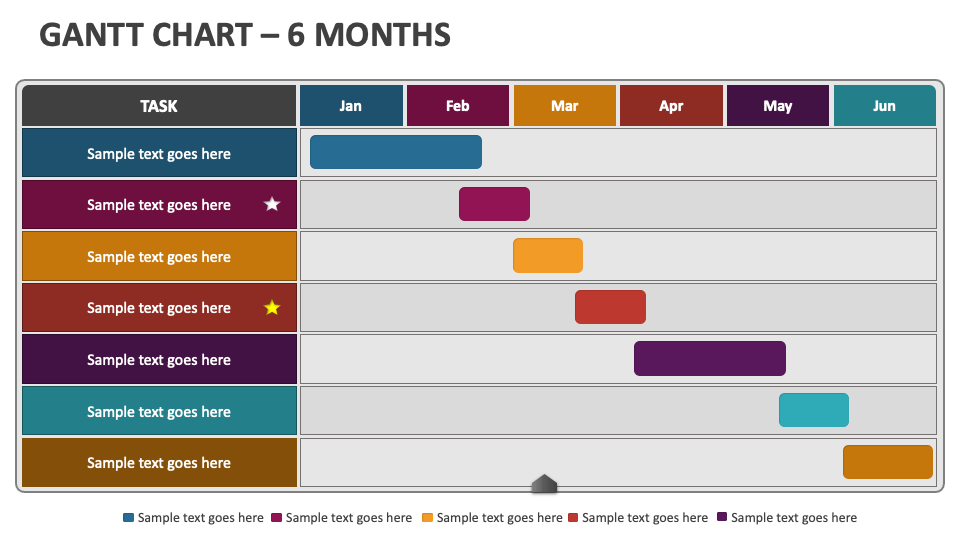
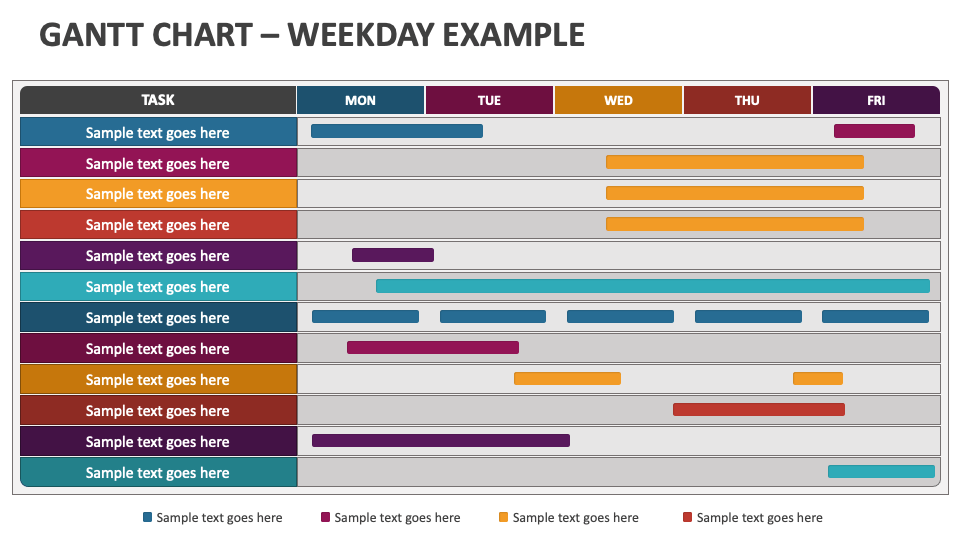
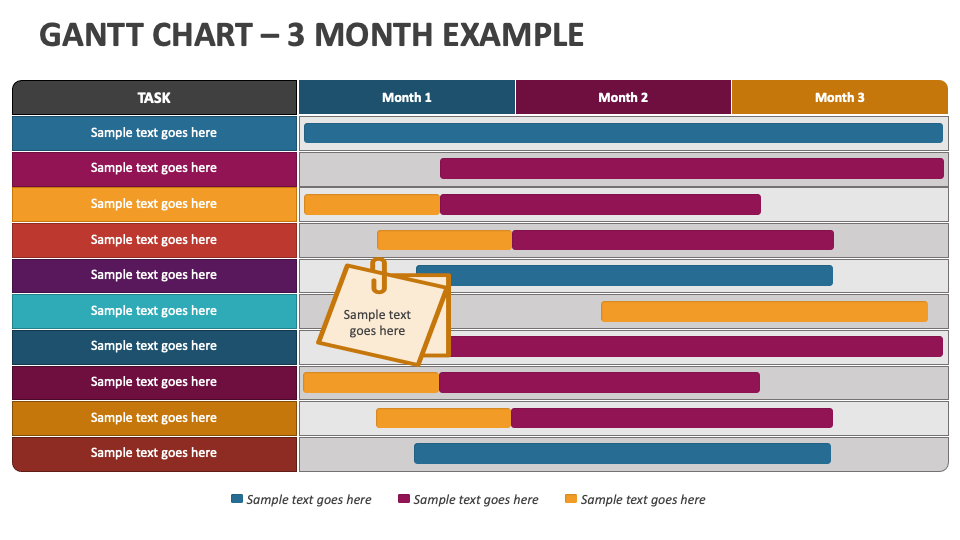
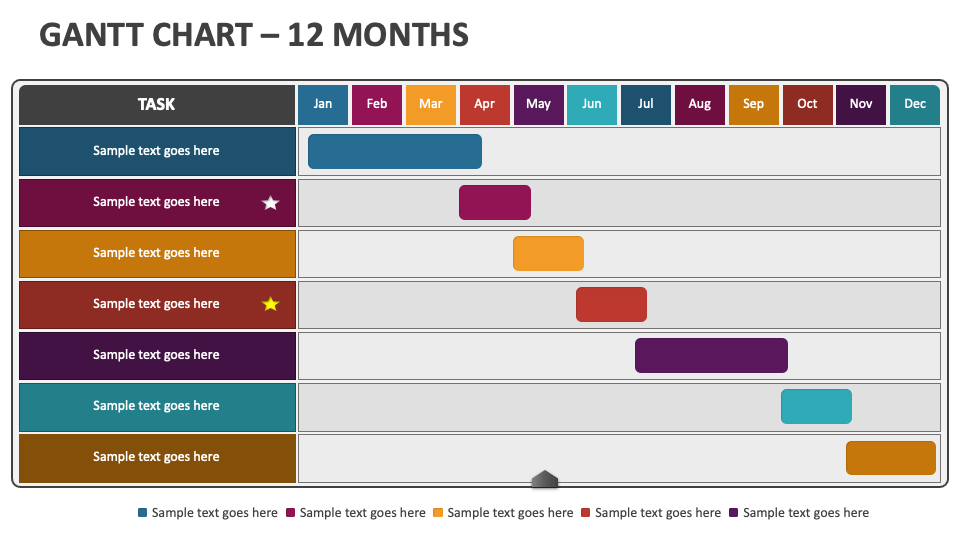
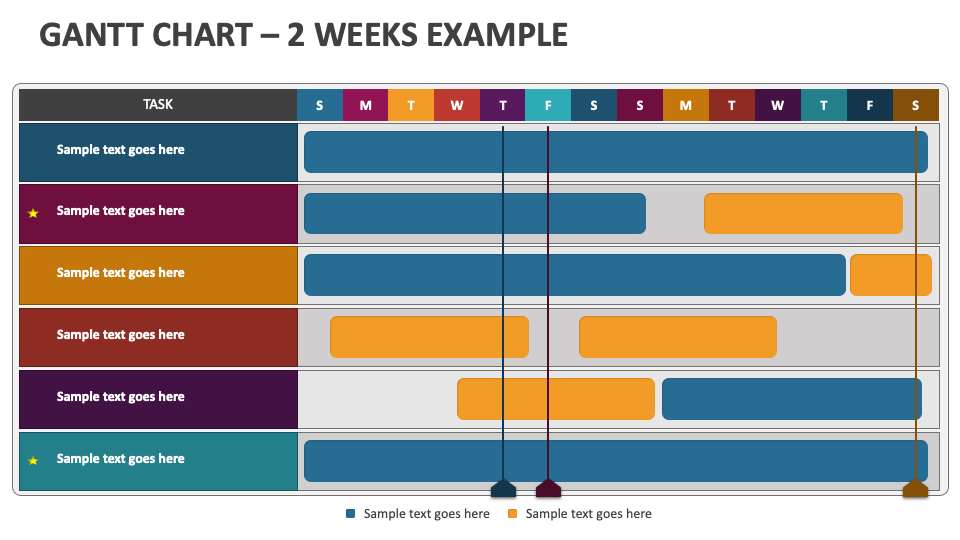
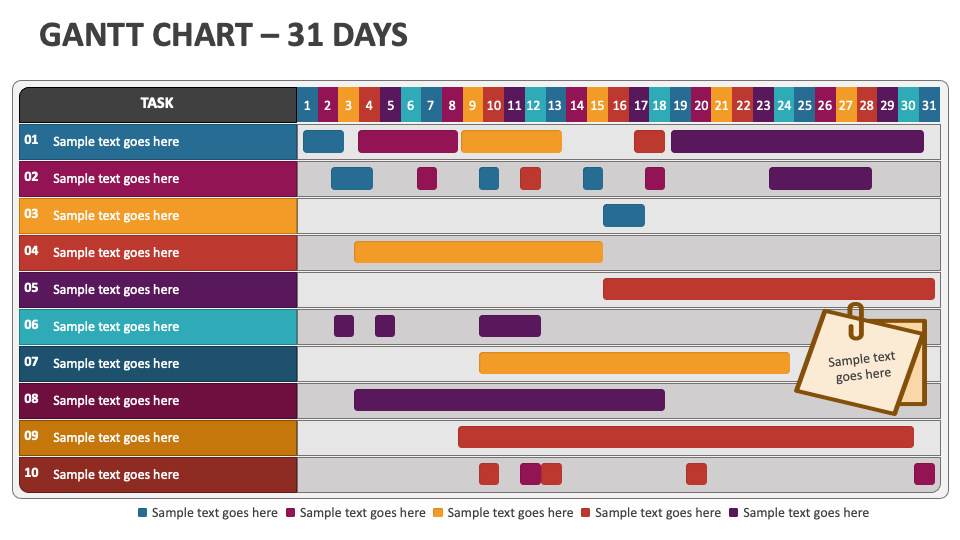
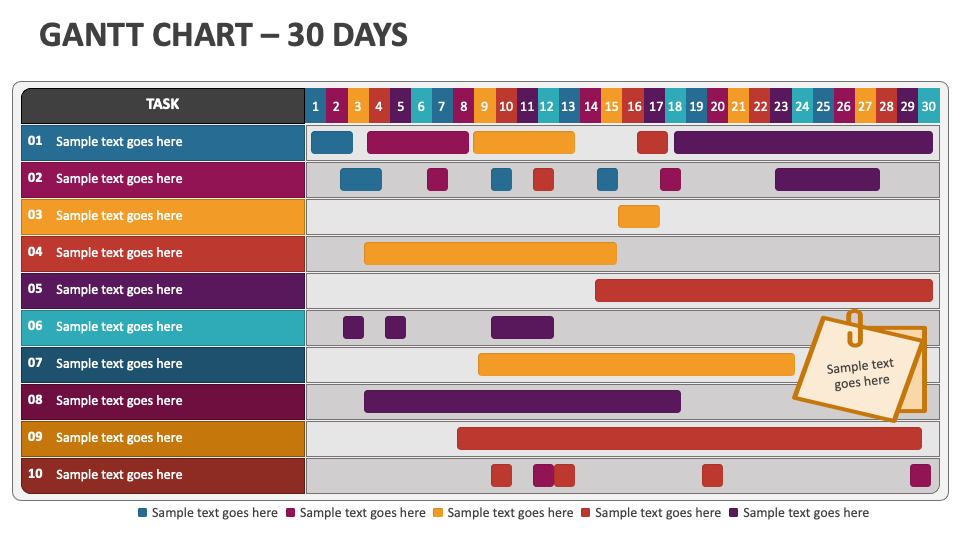
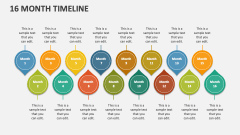
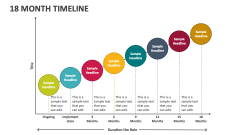
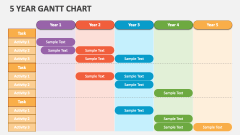
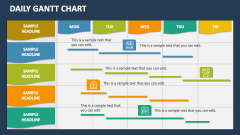
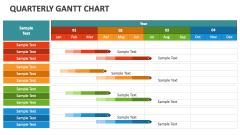
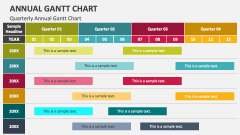
Lay your hands on our Gantt Charts for MS PowerPoint and Google Slides to depict the visual tool used in project management to outline and define project schedules. These stylish and trendy designs will elevate the visual appeal and sophistication of your slideshow.
This template is ideal for project managers to illustrate project timelines and deliverables for the upcoming week, month, or year. You can also shed light on the interdependencies among various project tasks. You can also visualize the schedule/sequence of events or activities related to different projects and the completion deadline. This professionally designed deck can be leveraged to present the task completion status effectively.