
Gear Infographics
In stock
$5.00
item details (7 Editable Slides)
- Applications Supported: PowerPoint, Google Slides
- File Type: .pptx, Google Slides
- Aspect Ratio:16:9 (Wide Screen)
- Animation: Yes
Gear Infographics
Gear Infographics
(7 Editable Slides)
Related Products

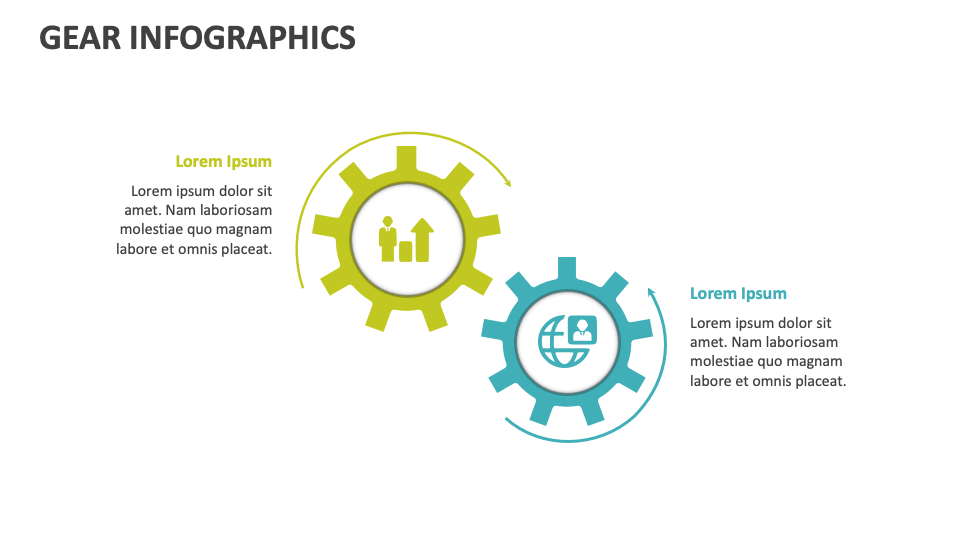
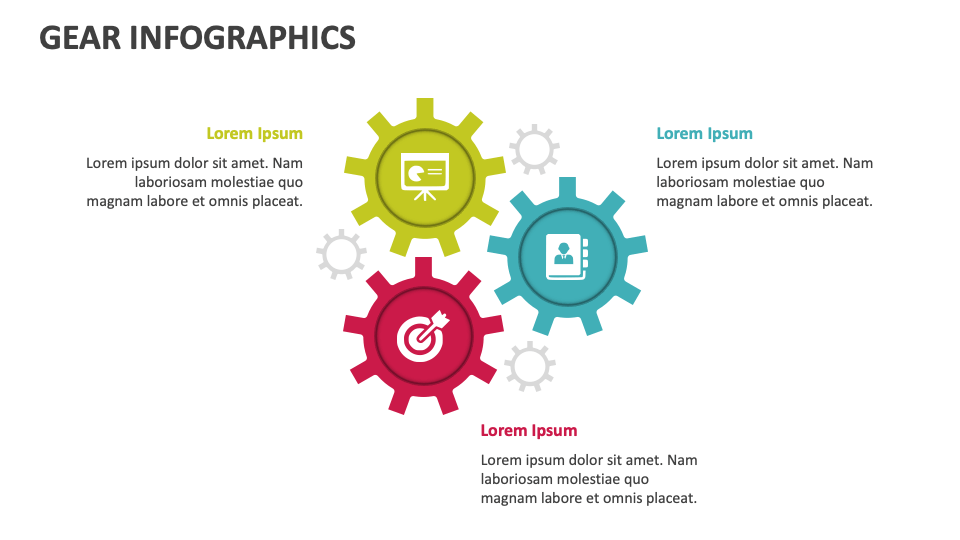
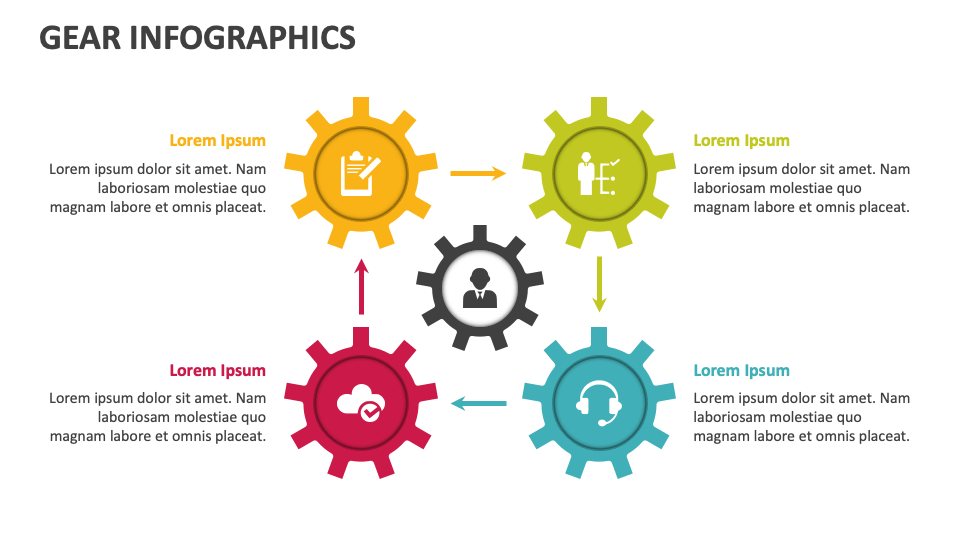
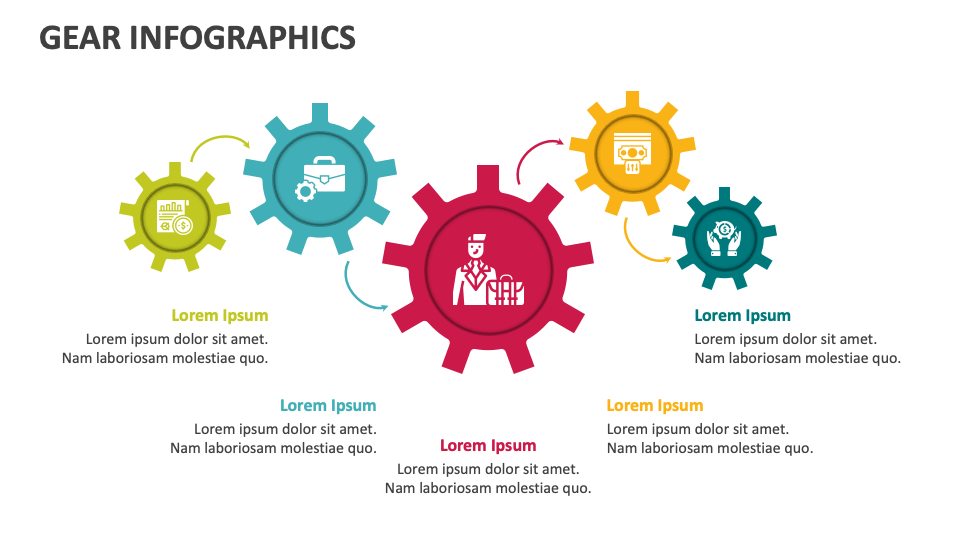
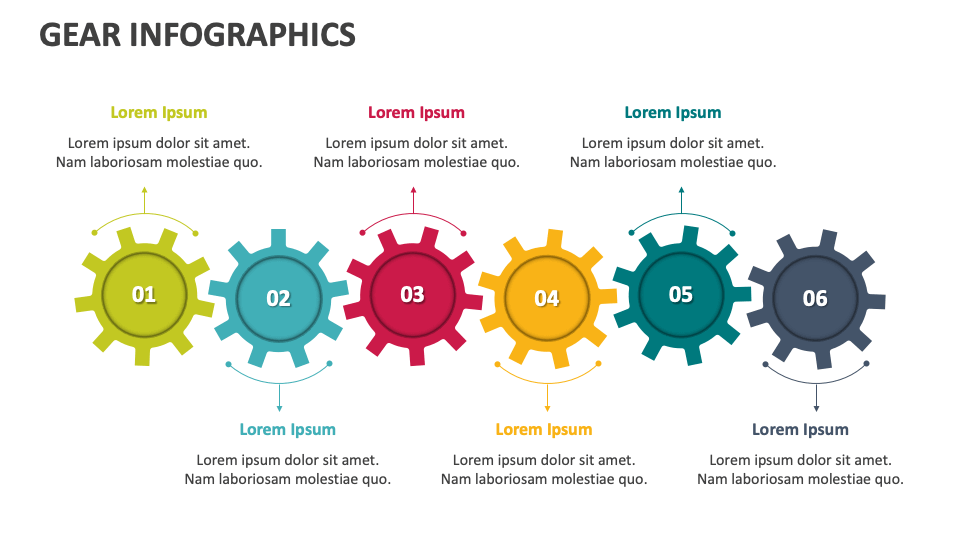
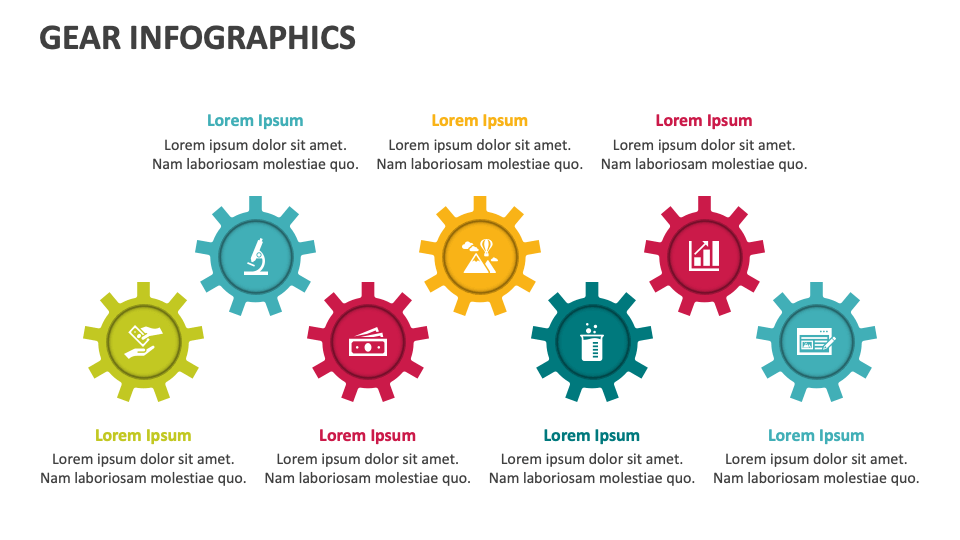
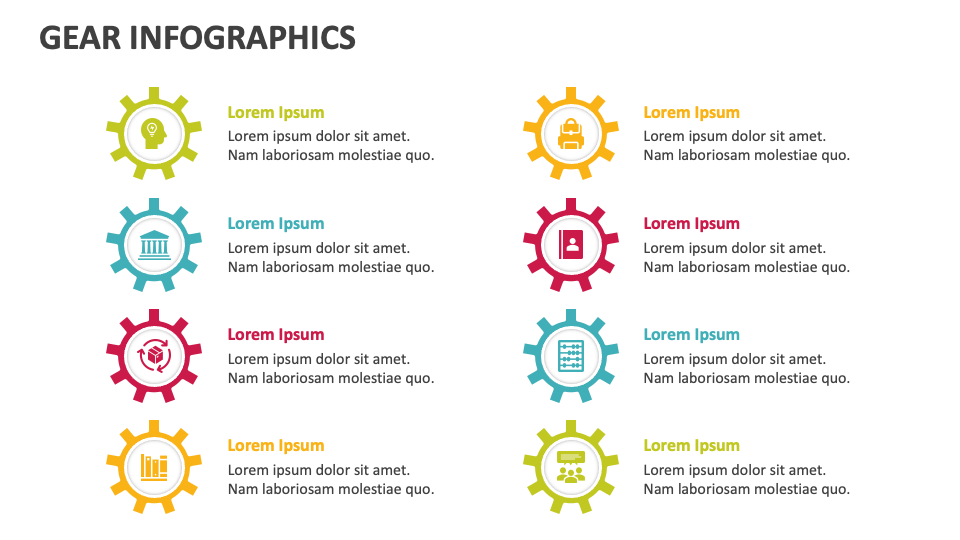
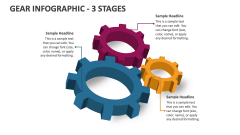
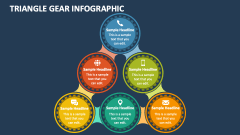
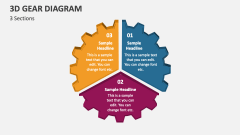
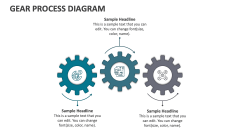
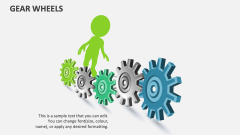
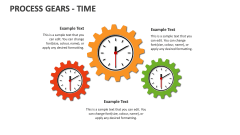
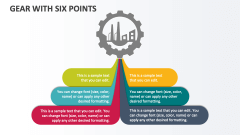
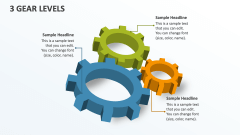
Capitalize on our Gear Infographics for MS PowerPoint and Google Slides to depict the steps of a process/workflow, the sequential progression of activity, various interdependent and interconnected tasks, and more.
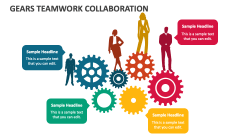
Business consultants can harness this editable deck to illustrate stages of entrepreneurship, business planning or growth steps, etc. Project heads can highlight the key phases and critical components of the project development cycle, important deliverables and milestones, and more. Team leaders and HR managers can visualize tips on enhancing collaboration and synergy between team members, ideas for team building activities, etc. Supply chain managers and manufacturing heads can visualize the stages of supply chain management.