
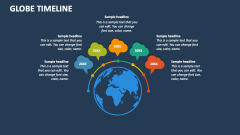
Globe Diagram
In stock
$5.00
item details (10 Editable Slides)
- Applications Supported: PowerPoint, Google Slides
- File Type: .pptx, Google Slides
- Aspect Ratio:16:9 (Wide Screen)
- Animation: Yes
Globe Diagram
Globe Diagram
(10 Editable Slides)
Related Products

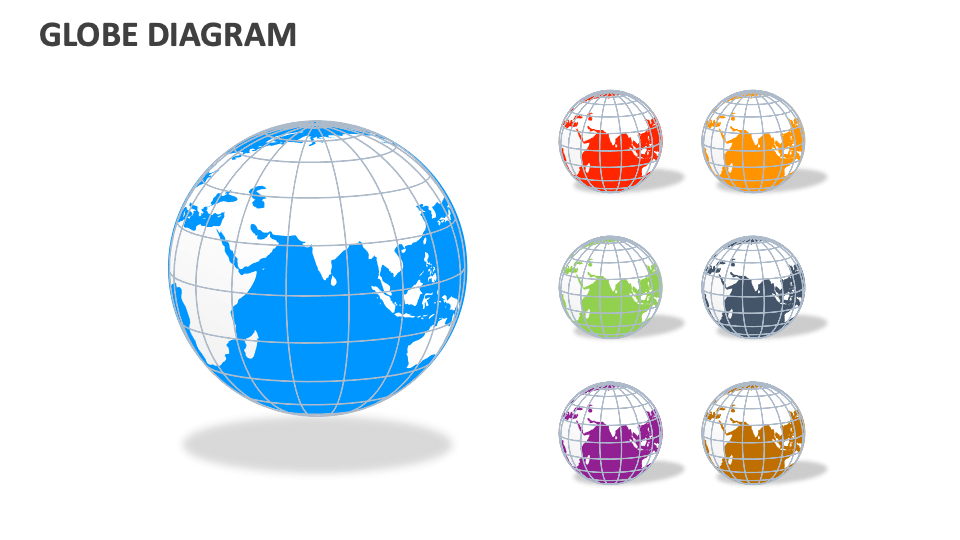
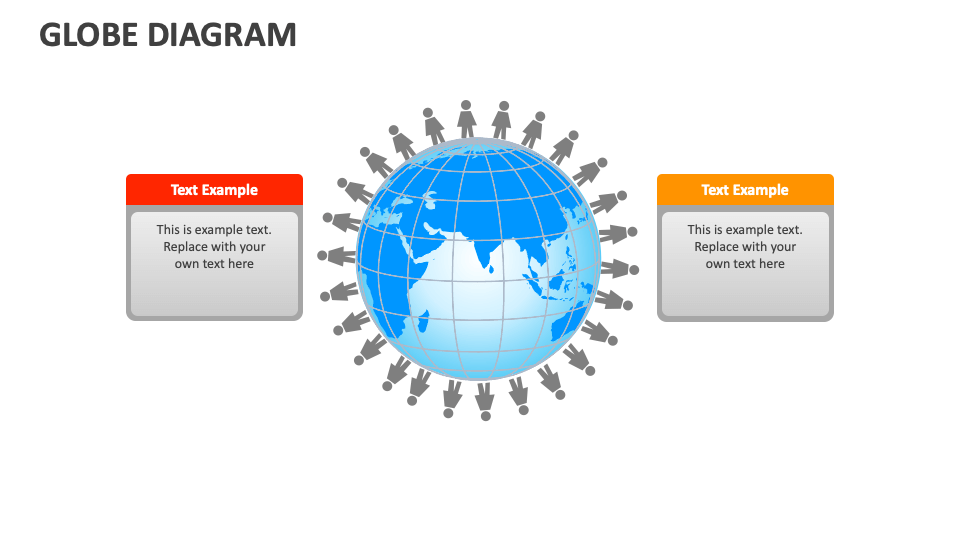
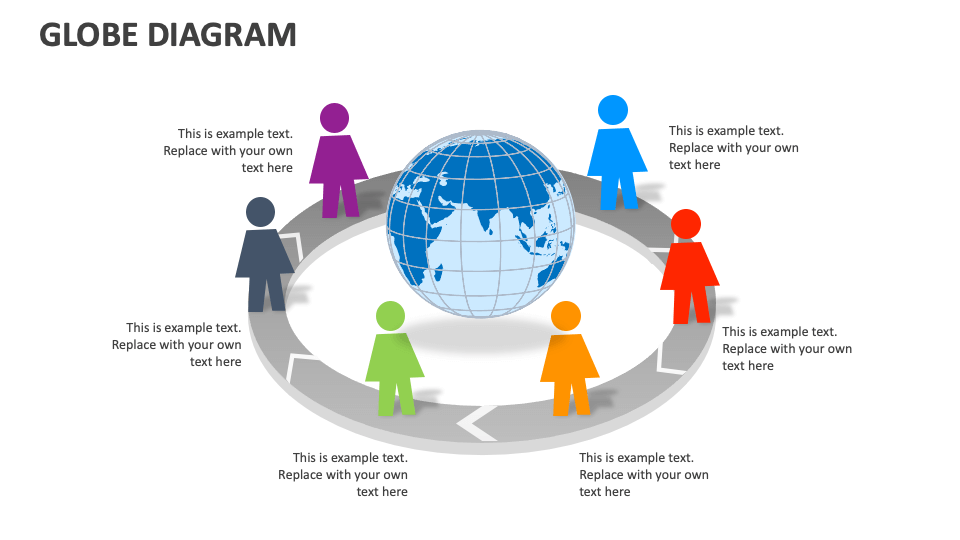
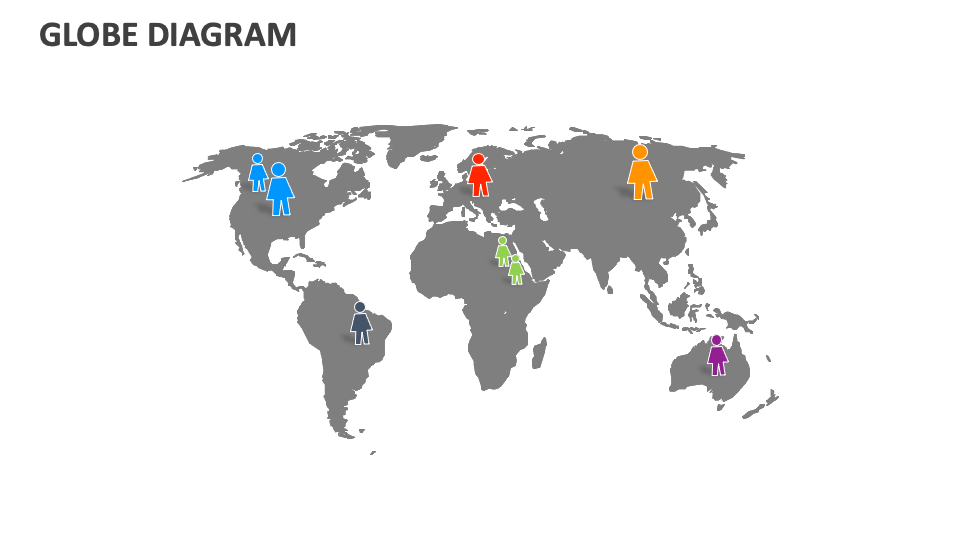
Our Globe Diagram for MS PowerPoint and Google Slides will help presenters from varied domains present topics such as market trends worldwide, major international trade routes, the global impact of environmental issues, demographic analysis in various continents, and much more. Download it now!
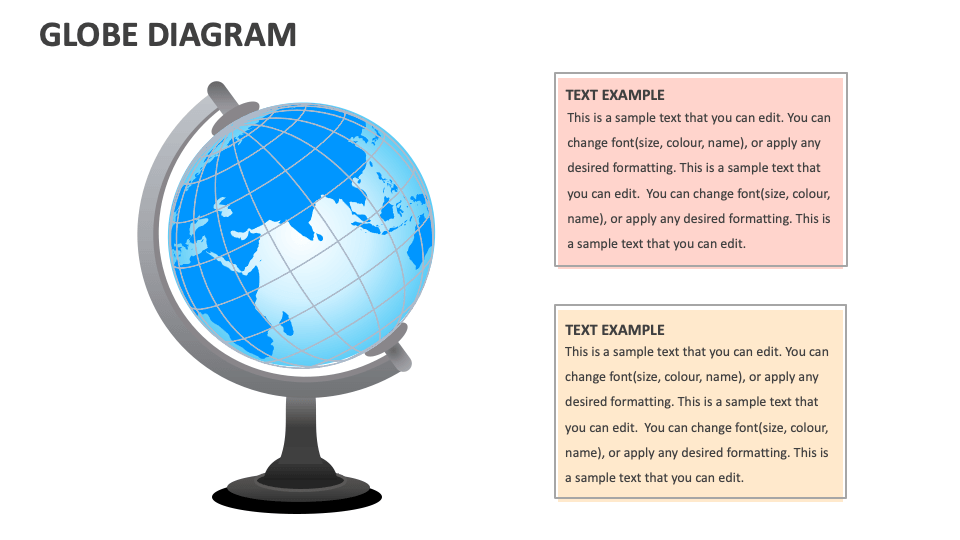
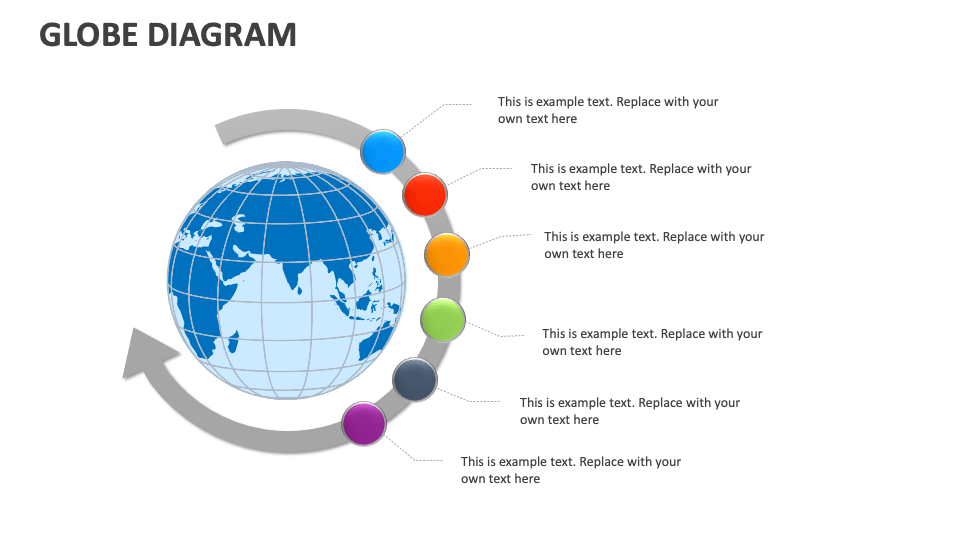
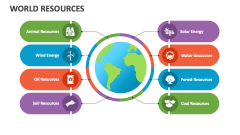
Business leaders can use this template to showcase the locations of their corporate offices, competitors, manufacturing units, key suppliers, and more in various countries/continents. Economists and researchers can visualize statistics or information about economic indicators across different countries in a clear and simplified manner. Educators can highlight the countries with the largest land area or highest population, lesser-known facts about continents, and more. You can also shed light on the population growth rates across specific continents or nations.