
Growth Share Matrix
In stock
$5.00
item details (2 Editable Slides)
- Applications Supported: PowerPoint, Google Slides
- File Type: .pptx, Google Slides
- Aspect Ratio:16:9 (Wide Screen)
- Animation: Yes
Growth Share Matrix
Growth Share Matrix
(2 Editable Slides)
Related Products


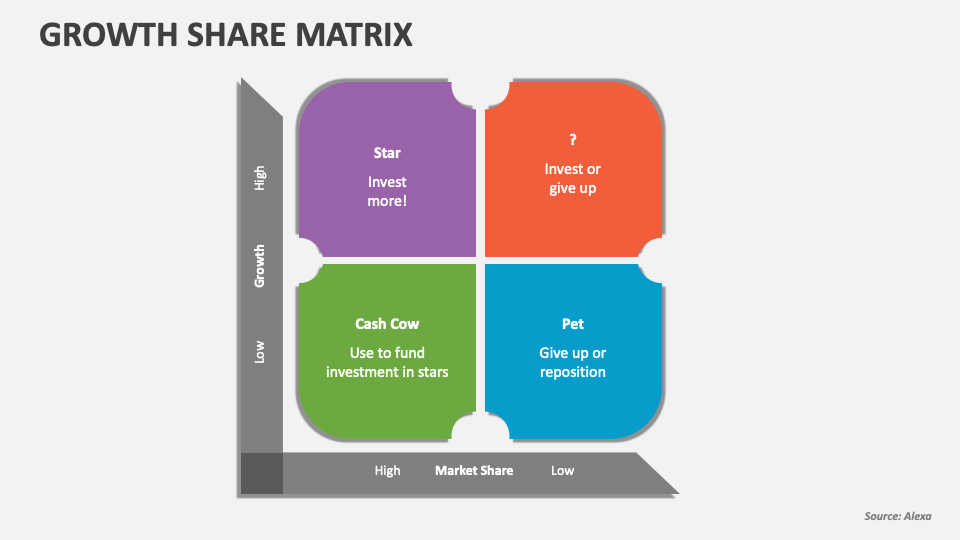
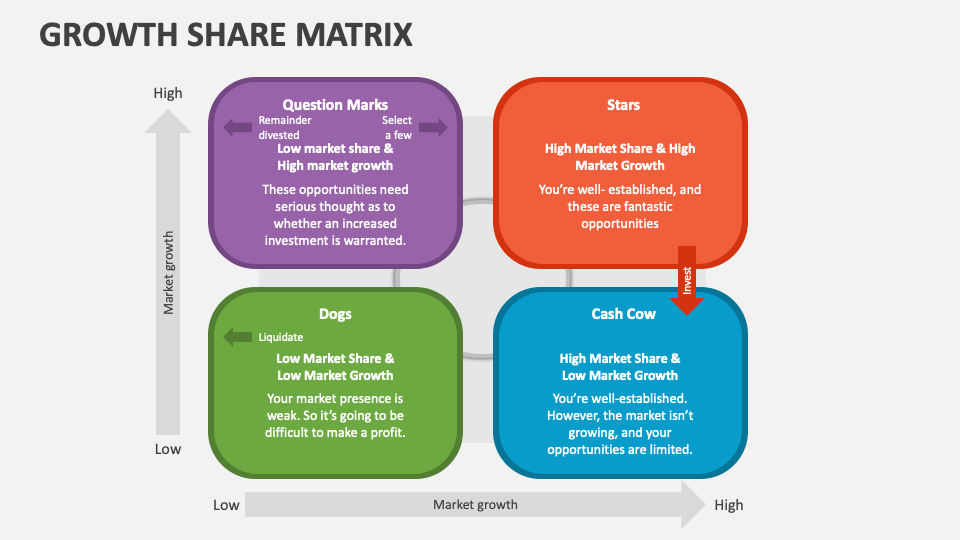
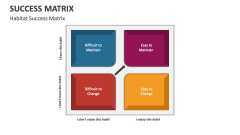
The growth-share matrix enables organizations to categorize their products or services based on their profitability degree. The matrix acts as an organizational portfolio management framework and helps enterprises decide how to prioritize their different businesses to yield maximum revenue and profits. Leverage our Growth-Share Matrix presentation template for Microsoft PowerPoint and Google Slides to educate your audience on this matrix's importance, significance, and other uses in a clear and impactful manner.
Product managers, chief strategists, marketing heads, and business leaders can leverage this fully customizable PPT to demonstrate the categorization of products into four quadrants based on their market share and growth Low Market Share and High Market Growth (Question Mark), High Market Share and Low Market Growth (Cash Cow), Low Market Share and Low Market Growth (Dogs), and High Market Share and High Market Growth (Star). You can also explain how this matrix helps companies recognize growth opportunities after analyzing the product portfolios and make well-informed decisions regarding product discontinuation or further investment.