
Influence Diagram
In stock
$5.00
item details (4 Editable Slides)
- Applications Supported: PowerPoint, Google Slides
- File Type: .pptx, Google Slides
- Aspect Ratio:16:9 (Wide Screen)
- Animation: Yes
Influence Diagram
Influence Diagram
(4 Editable Slides)
Related Products


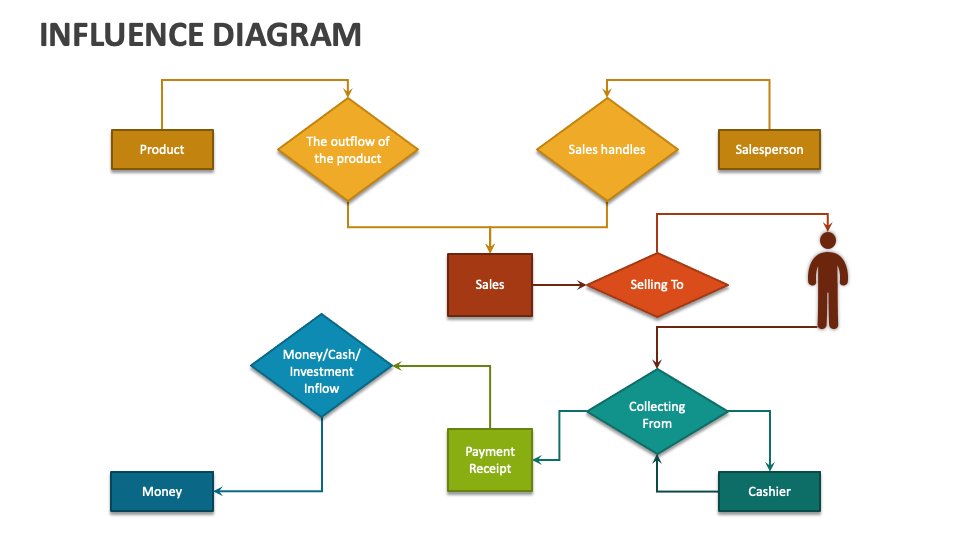
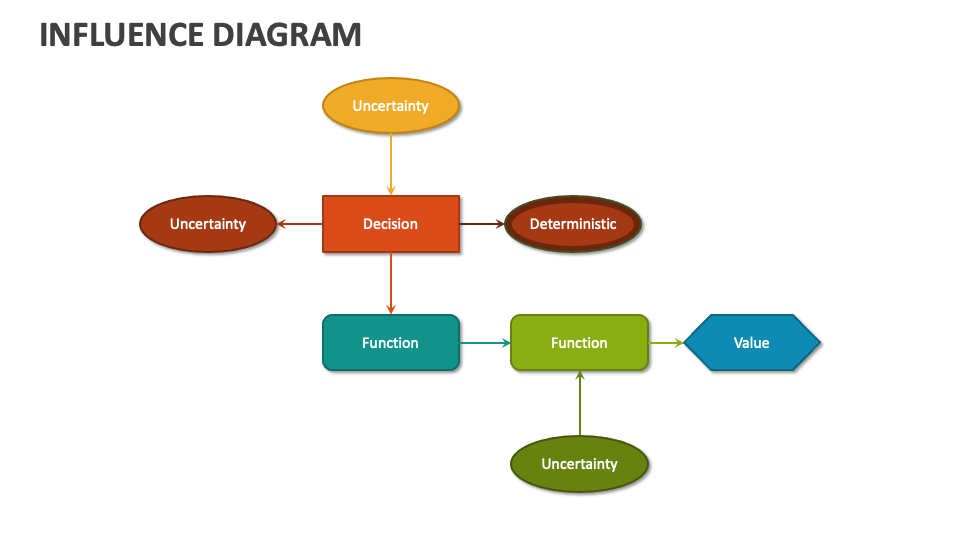
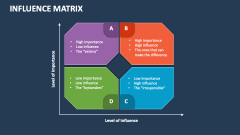
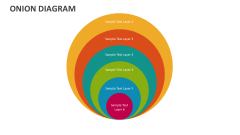
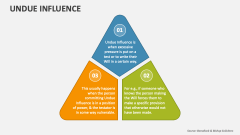
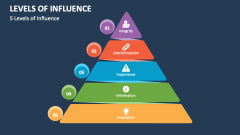
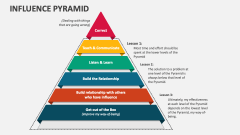
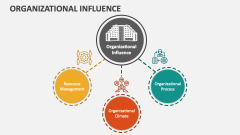
An Influence Diagram is a representation of the dependencies among variables or factors in a system or decision-making process. Our professionally designed presentation template for MS PowerPoint and Google Slides is perfect for depicting the key aspects and intrinsic details related to this diagram.
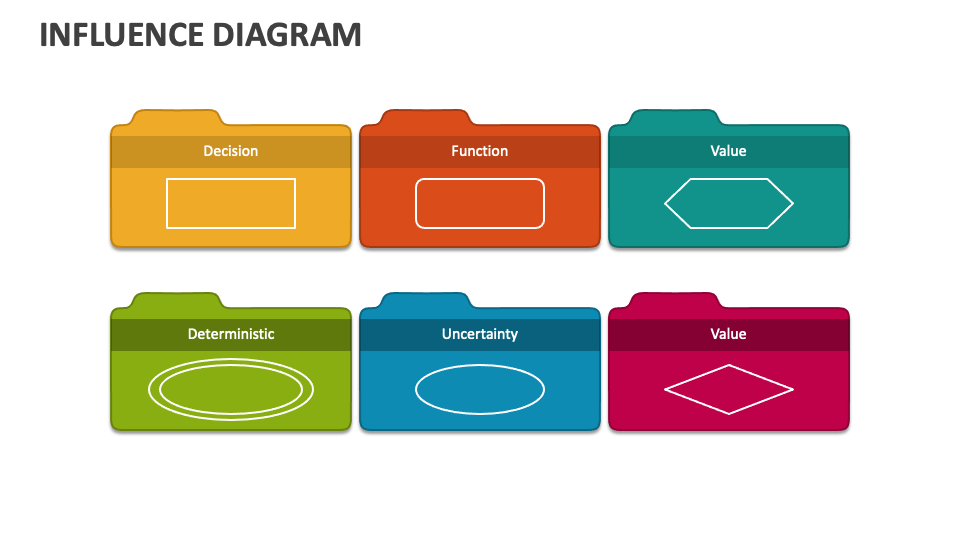
Business leaders will find this deck helpful in explaining how the influence diagram works and what different symbols/nodes indicate. You can showcase the role of this diagram in visualizing complex systems and analyzing the cause-and-effect relationships between different nodes and variables within the system. Moreover, you can highlight the usages and benefits of the influence diagram.