
Key Statistics
In stock
$5.00
item details (4 Editable Slides)
- Applications Supported: PowerPoint, Google Slides
- File Type: .pptx, Google Slides
- Aspect Ratio:16:9 (Wide Screen)
- Animation: Yes
Key Statistics
Key Statistics
(4 Editable Slides)
Related Products


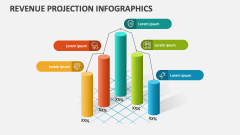
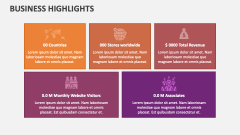
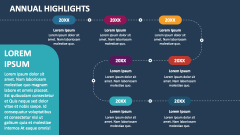
Grab our Key Statistics template for MS PowerPoint and Google Slides to highlight survey results and numerical-based figures and data in a visually engaging manner. The deck comprises visuals of bar graphs, percentage diagrams, and more and will help you add the needed impact to the presentations.
Technology experts can utilize this deck to illustrate the statistics on digital adoption, AI integration in industries, etc. Business leaders can shed light on the percentage distribution of budget across various organizational departments. Financial professionals can visualize a company’s revenues, sales, profitability, and other key metrics over time. Customer success managers and marketing heads can depict the growth/decline in customer satisfaction levels, percentage-wise conversion from different social media platforms, and more.