
Learning Curve
In stock
$5.00
item details (10 Editable Slides)
- Applications Supported: PowerPoint, Google Slides
- File Type: .pptx, Google Slides
- Aspect Ratio:16:9 (Wide Screen)
- Animation: Yes
Learning Curve
Learning Curve
(10 Editable Slides)
Related Products


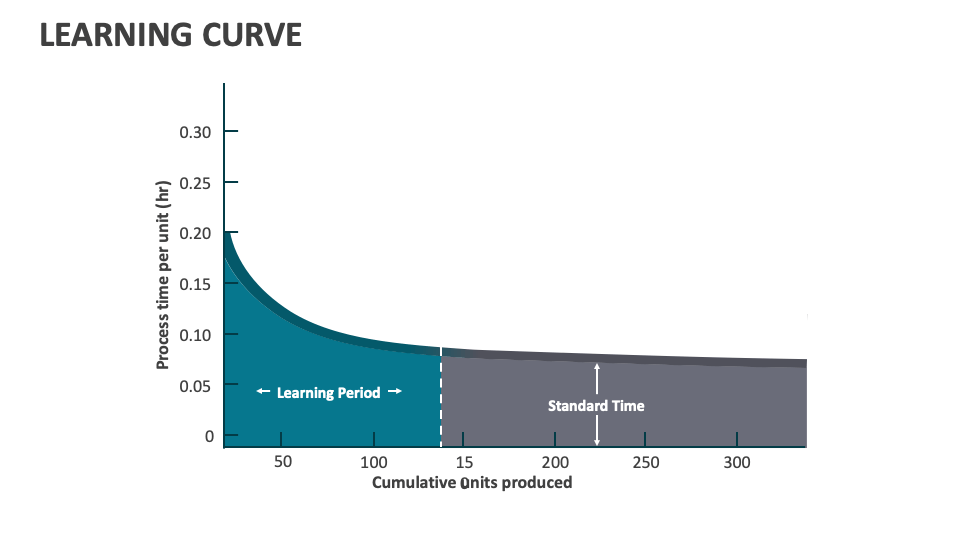
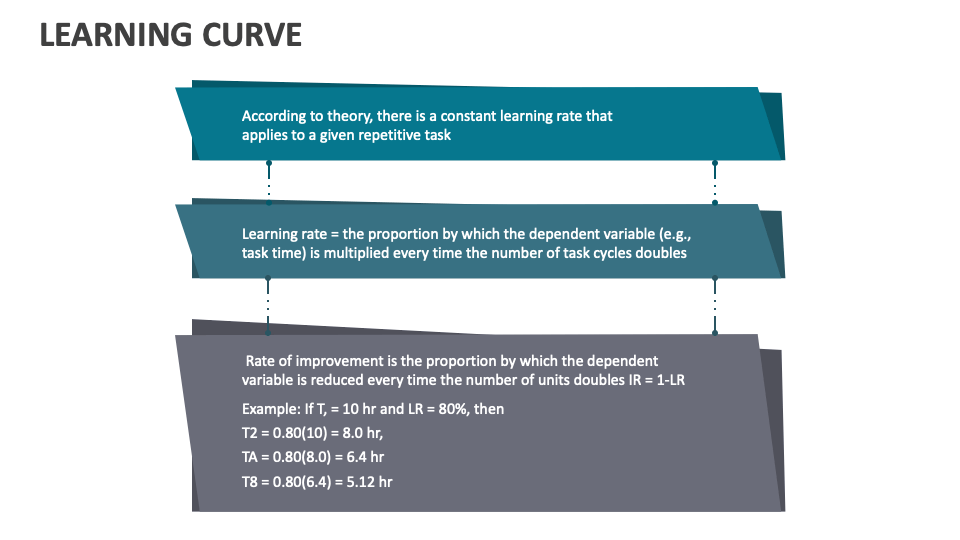
Grab our Learning Curve presentation template for MS PowerPoint and Google Slides to describe the rate at which someone learns new skills or a company improves efficiency while producing goods or services. Enhance the readability and comprehension of information by incorporating these high-resolution visuals into your slides.
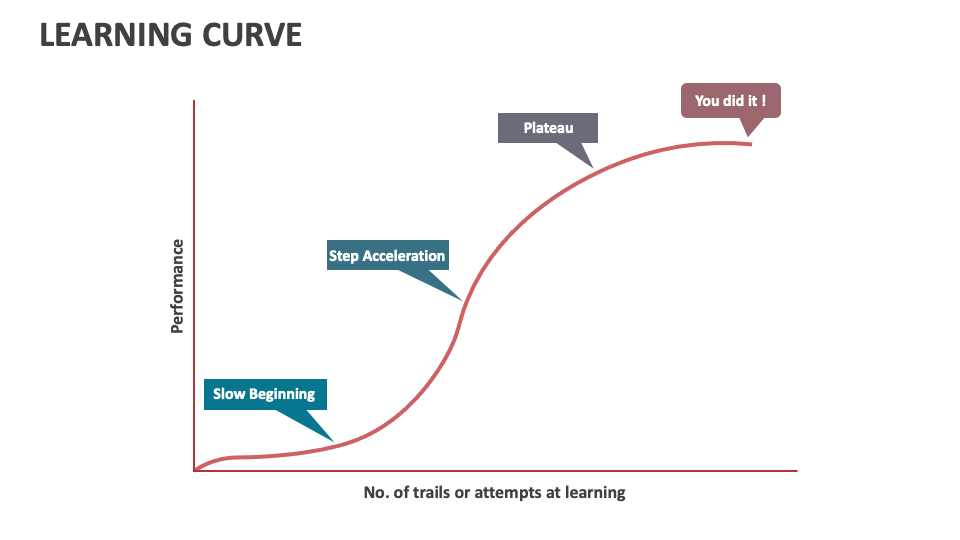
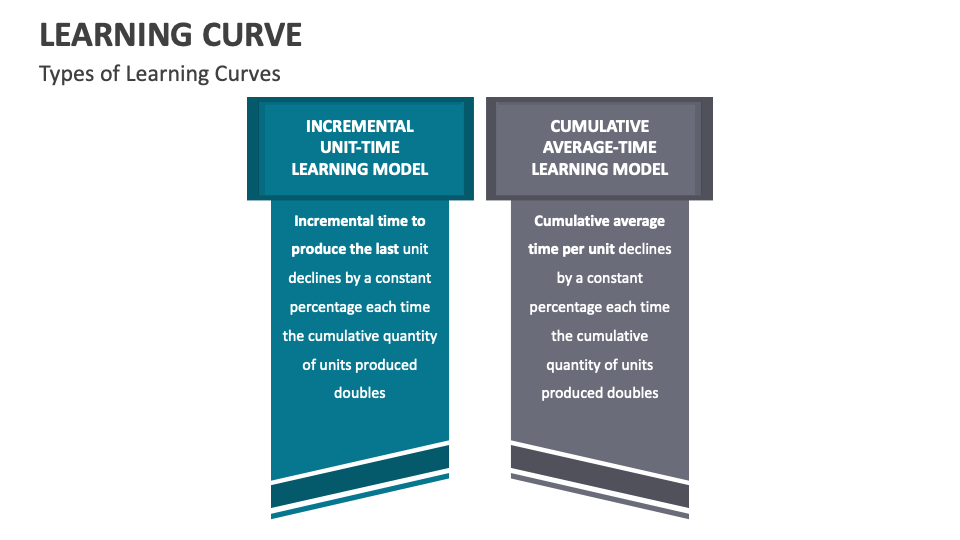
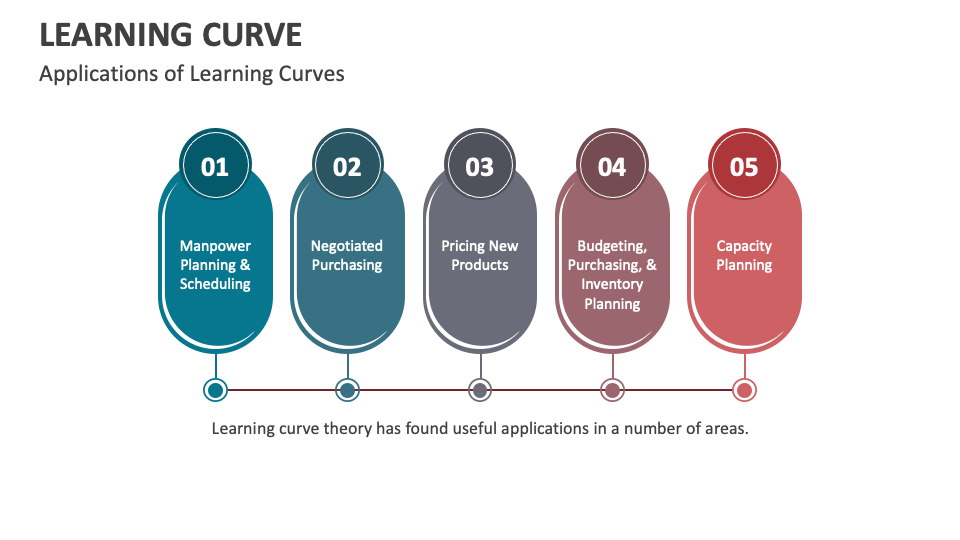
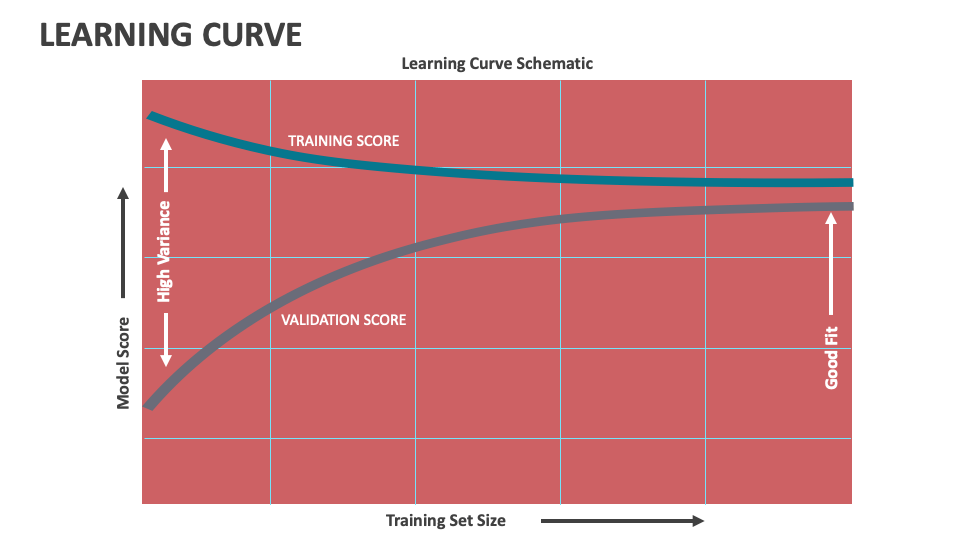
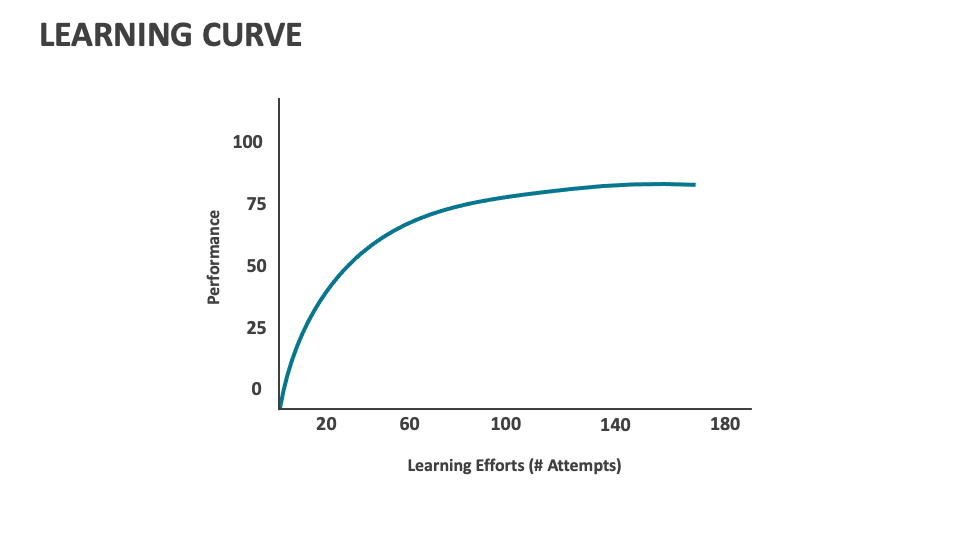
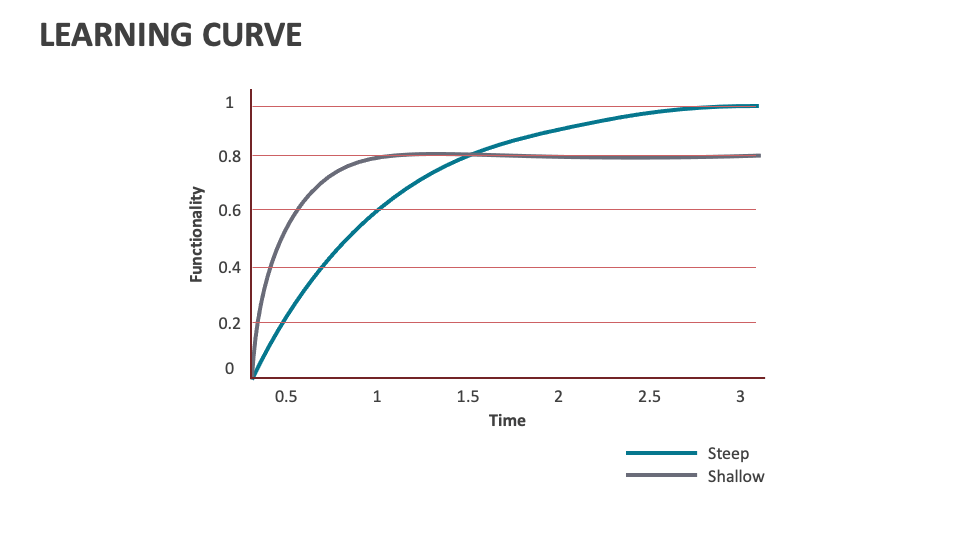
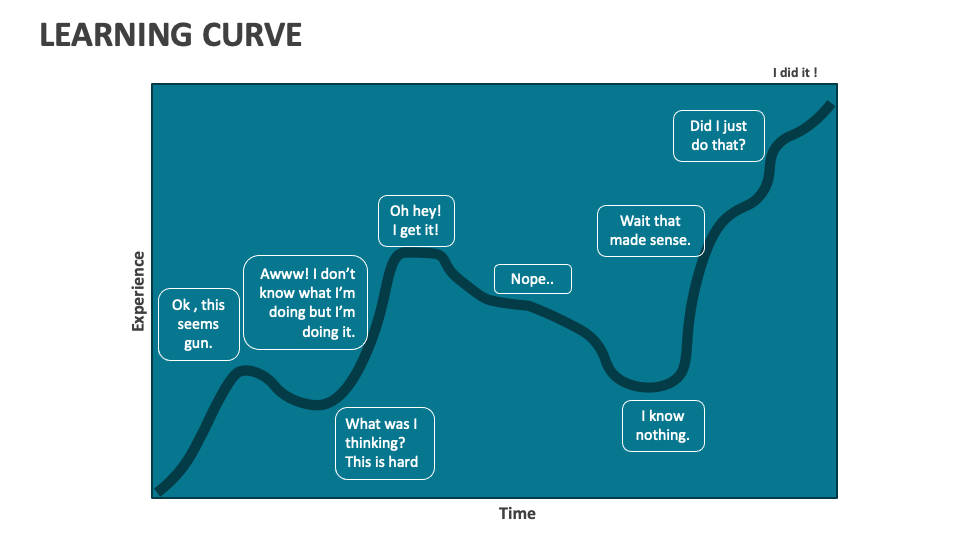
Educators, instructors, and senior managers can explain to the intended audience the different types and applications of learning curves. You can shed light on the methods to calculate learning rate and rate of improvement. You can further illustrate how performance improves over time or with more attempts, and the curve gradually levels off, signifying mastery or increased efficiency. You can showcase a graphical illustration of the learning curve based on the performance and number of trials at learning.