




Liquid Glass Sphere
In stock
$5.00
item details (9 Editable Slides)
- Applications Supported: PowerPoint, Google Slides
- File Type: .pptx, Google Slides
- Aspect Ratio:16:9 (Wide Screen)
- Animation: Yes
Liquid Glass Sphere
Liquid Glass Sphere
(9 Editable Slides)
Related Products
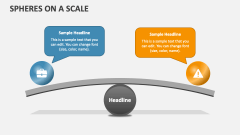
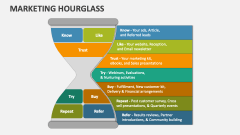
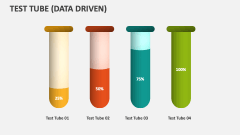
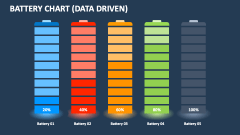
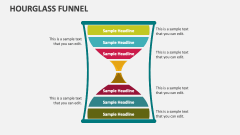
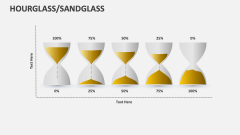
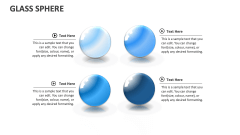
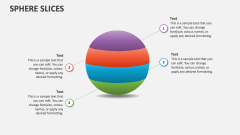

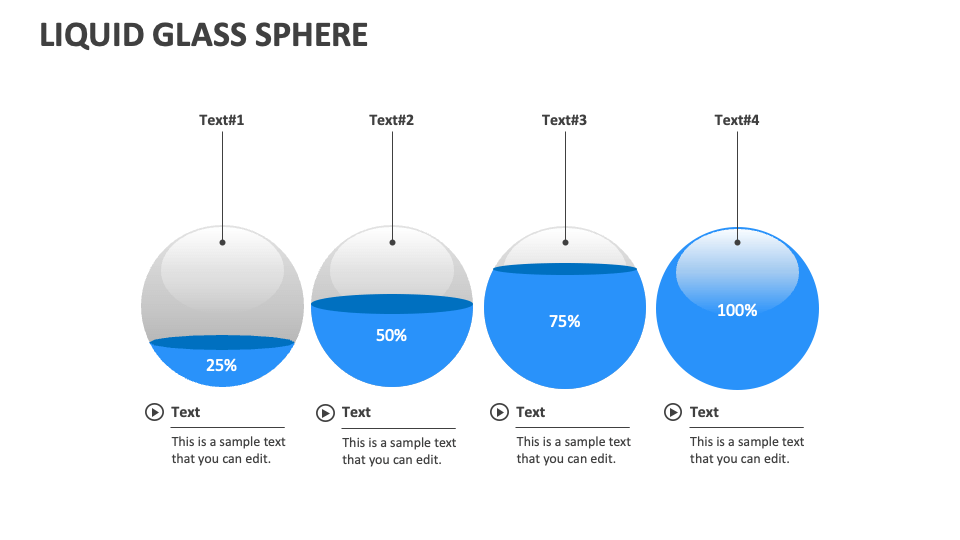
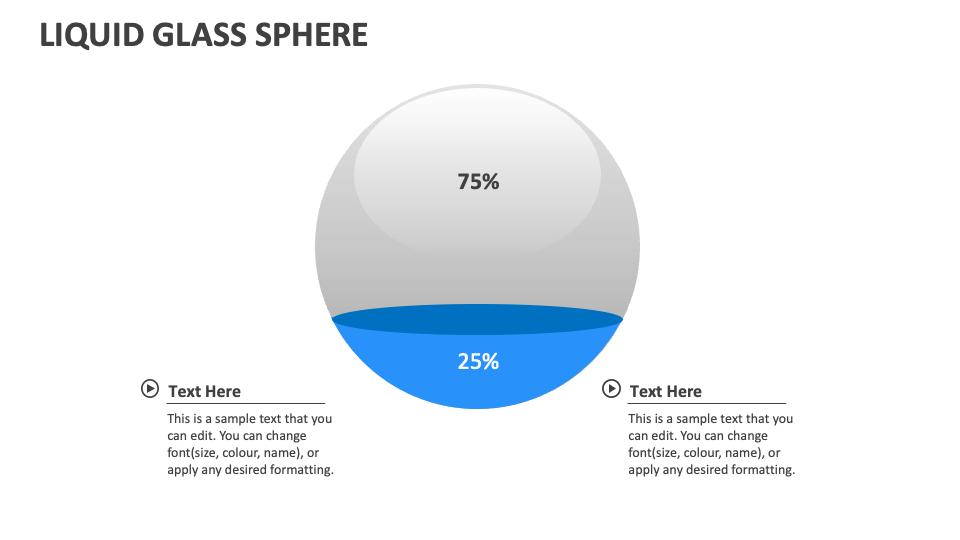
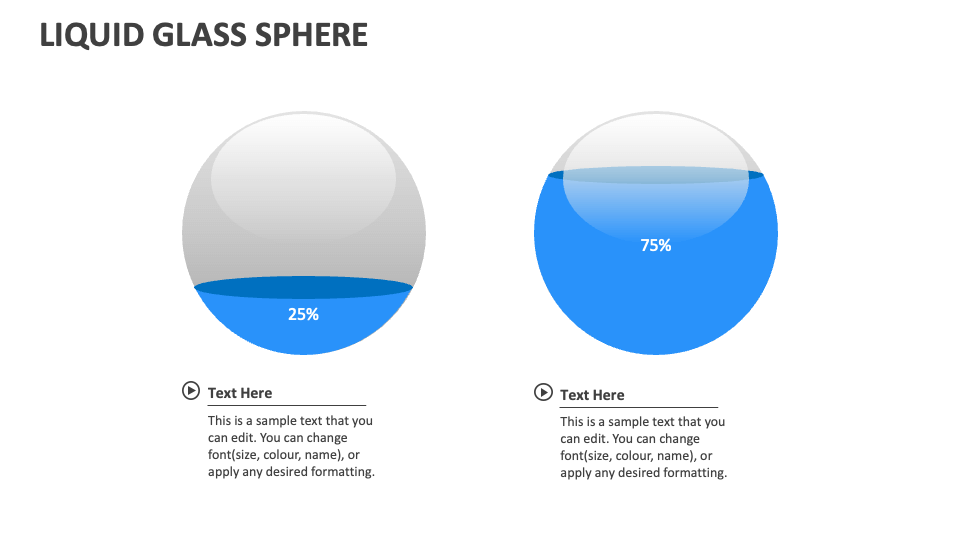
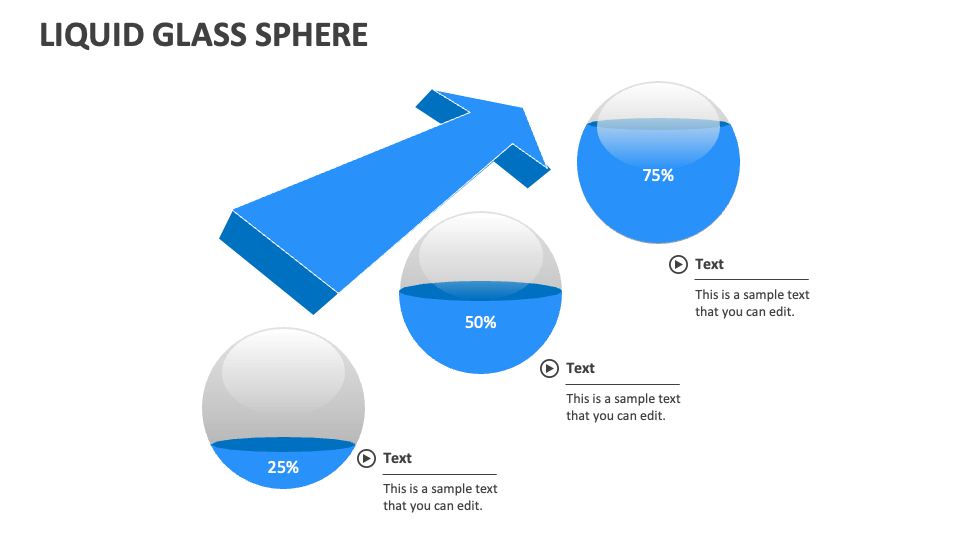
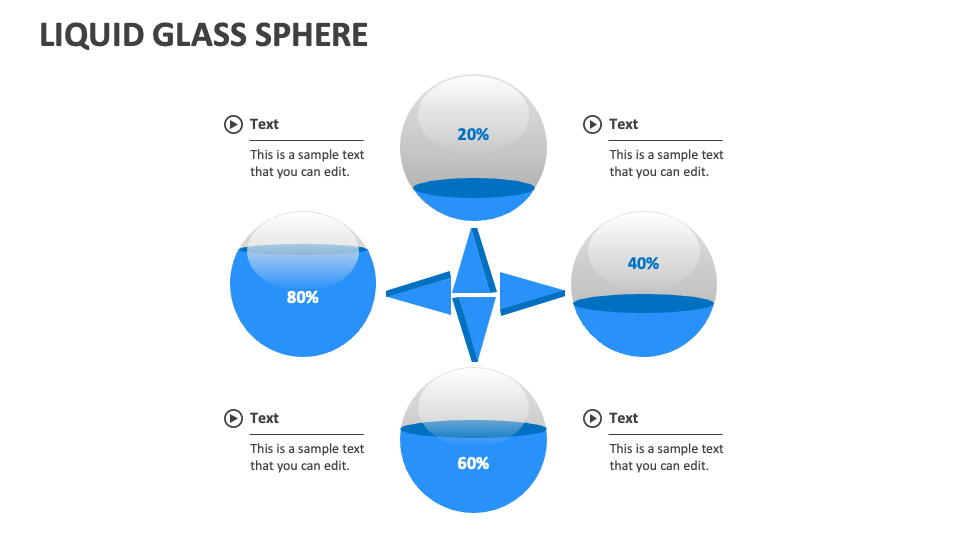
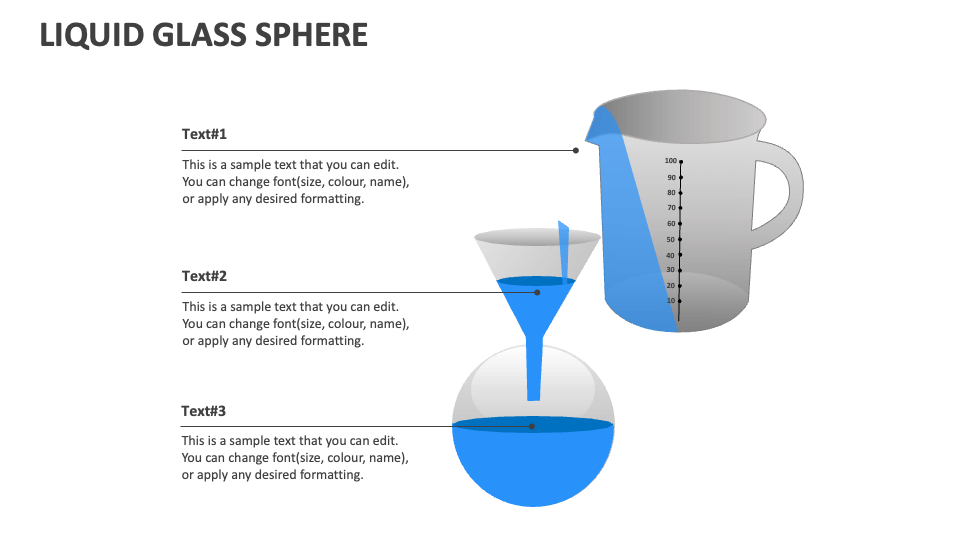
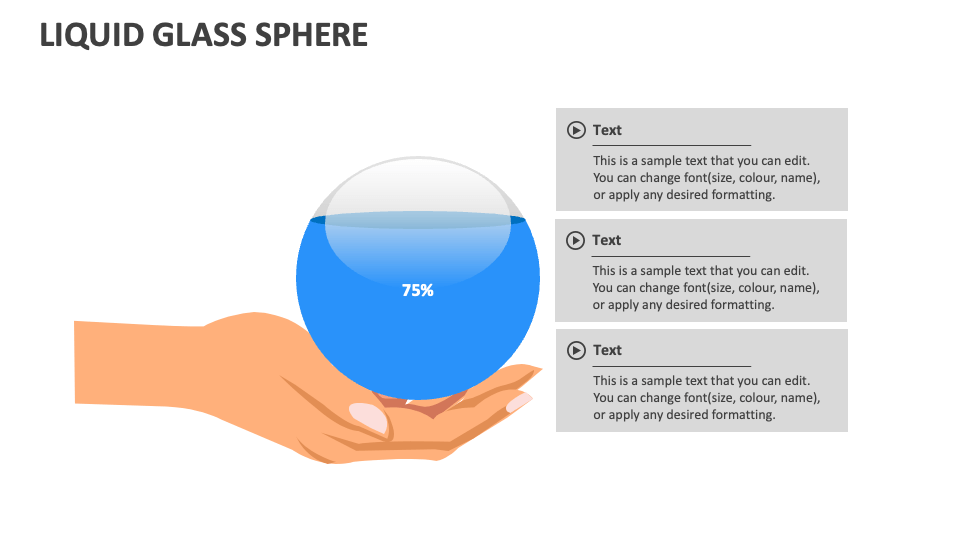
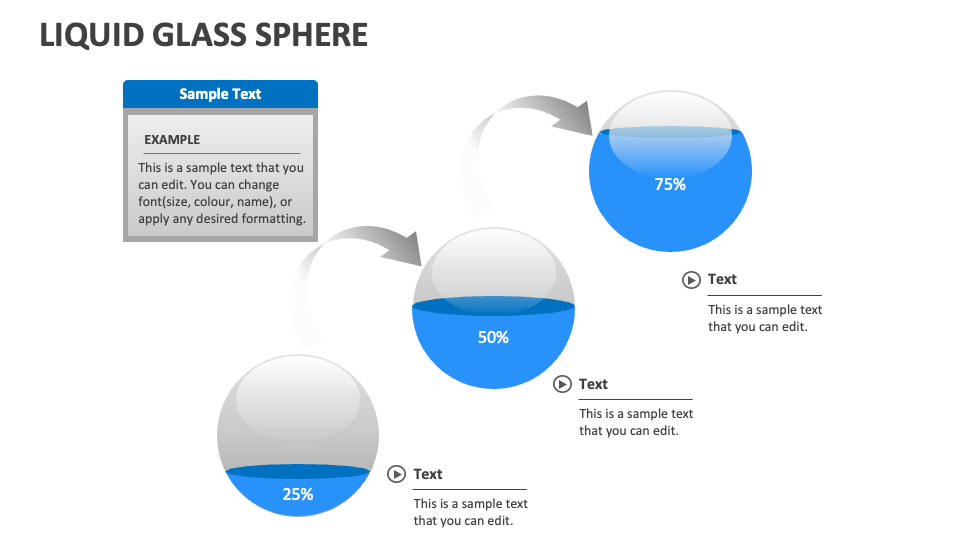
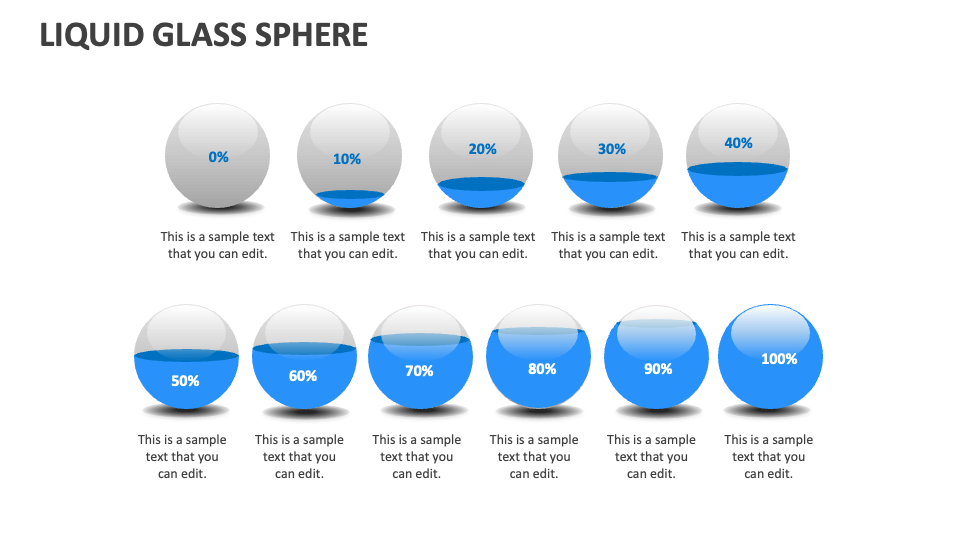
Leverage our Liquid Glass Sphere MS PowerPoint and Google Slides presentation template to depict topics like percentage-based data visualization, resource allocation, change in data, and more. You have the flexibility to showcase your tailored content within the text placeholders and freely reposition them anywhere on the slide.
Market analysts can make the most of this deck to present a comparative overview of the market share of different competitors or product categories within an industry. Business leaders and financial heads can explain to the intended audience how budgetary resources are allocated across different expenditure categories and departments. Sales heads can capitalize on this set to showcase customer segments based on various factors, such as their level of engagement, spending, satisfaction, etc.