
Matrix Icons
In stock
$5.00
item details (1 Editable Slide)
- Applications Supported: PowerPoint, Google Slides
- File Type: .pptx, Google Slides
- Aspect Ratio:16:9 (Wide Screen)
- Animation: No
Matrix Icons
Matrix Icons
(1 Editable Slide)
Related Products
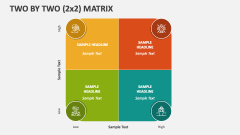
If you want to add an aesthetic appeal to your presentations, incorporate our Matrix Icons for MS PowerPoint and Google Slides into your slides. The slide is filled with icons of matrices in diverse color combinations.
Business leaders can use this icon set to focus the audience’s attention on the information about their business’s SWOT analysis, comparison of product features with other brands, etc. Researchers can make the most of these icons to add a layer of comprehension to statistical data on population, literacy rates in a region/state, etc. Educators can enrich their text pertaining to the different types of matrix operations and their practical applications. You can also pair these icons with content about the impact effort matrix, market segment matrix, and more.