
Maturity Diagram
In stock
$5.00
item details (9 Editable Slides)
- Applications Supported: PowerPoint, Google Slides
- File Type: .pptx, Google Slides
- Aspect Ratio:16:9 (Wide Screen)
- Animation: Yes
Maturity Diagram
Maturity Diagram
(9 Editable Slides)

Related Products
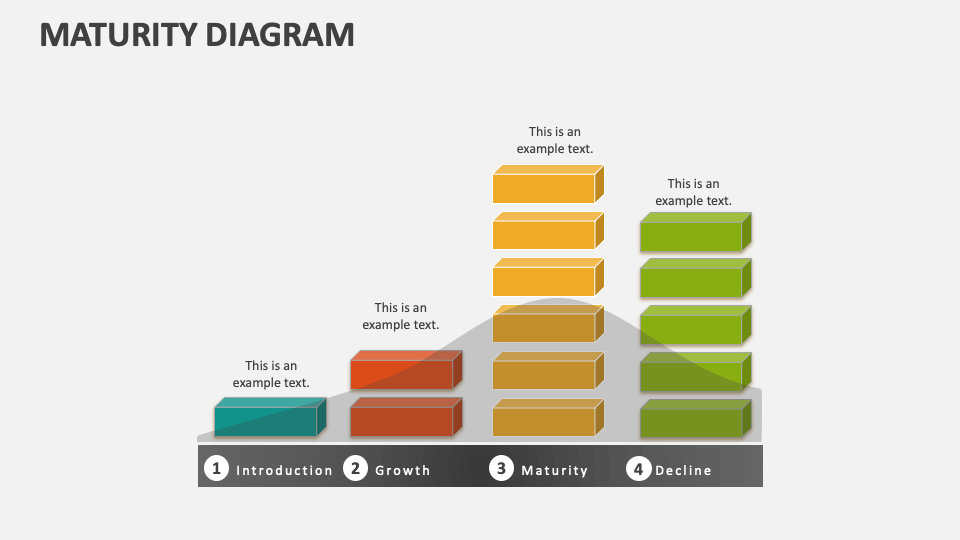
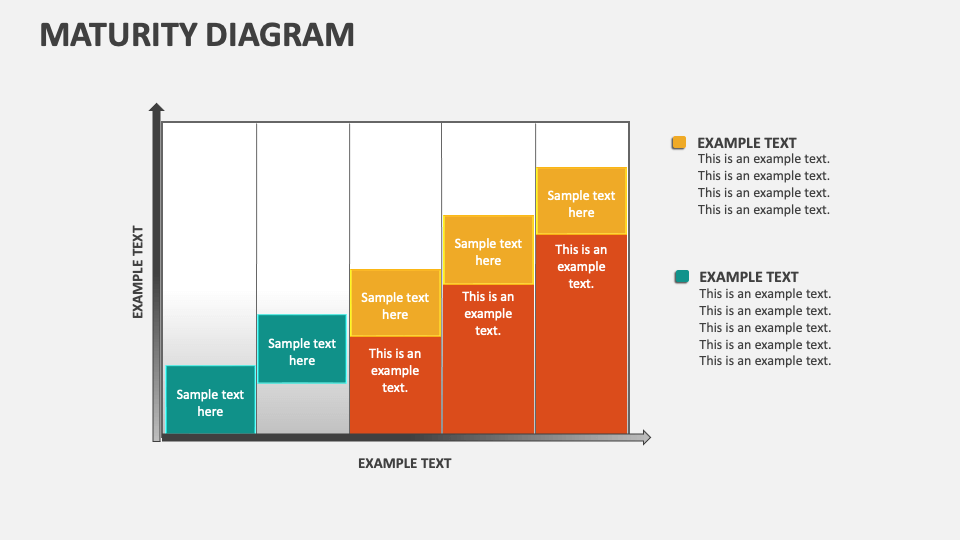
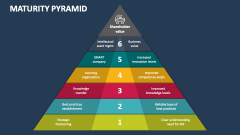
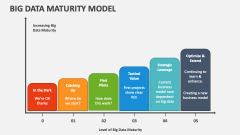
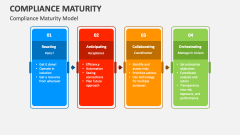
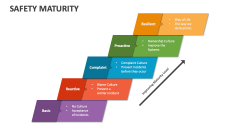
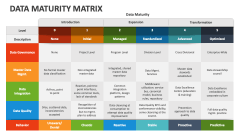
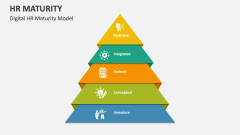
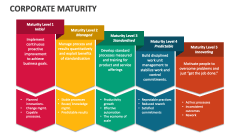
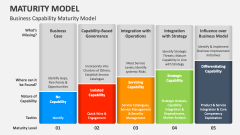
Our Maturity Diagram for MS PowerPoint and Google Slides is the perfect visual aid for depicting the stages of development or progress within a specific domain. The template comprises high-resolution visuals that will help you present content on screens of different sizes without difficulty.
Chief financial officers can leverage the deck to showcase the role of the financial maturity model in objectively evaluating a business’s financial management efficiency. IT heads can explain how, in an IT maturity model, a higher level signifies quality outputs and desired business growth, and lower levels indicate adaptability and quality issues. You can also visualize the strategies to advance to the desired level in a particular maturity model.