
Month Comparison
In stock
$5.00
item details (3 Editable Slides)
- Applications Supported: PowerPoint, Google Slides
- File Type: .pptx, Google Slides
- Aspect Ratio:16:9 (Wide Screen)
- Animation: Yes
Month Comparison
Month Comparison
(3 Editable Slides)

Related Products
![Project Planner for [Month] - Slide 1](https://www.collidu.com/media/catalog/product/img1/b/5/b5bec7dec3793779483c56805e60140ffd3c6d384c652b16cbd1163232200740/project-monthly-planner-slide1.png)
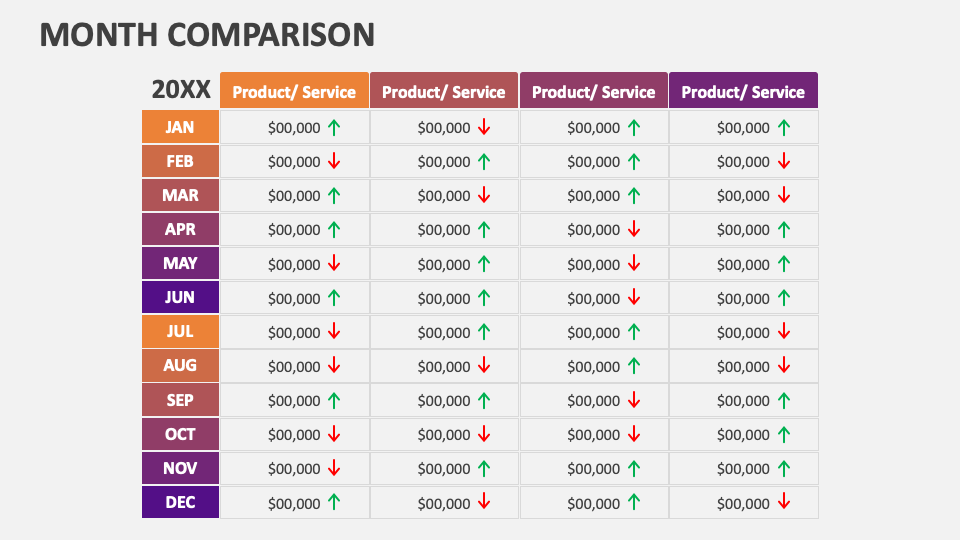
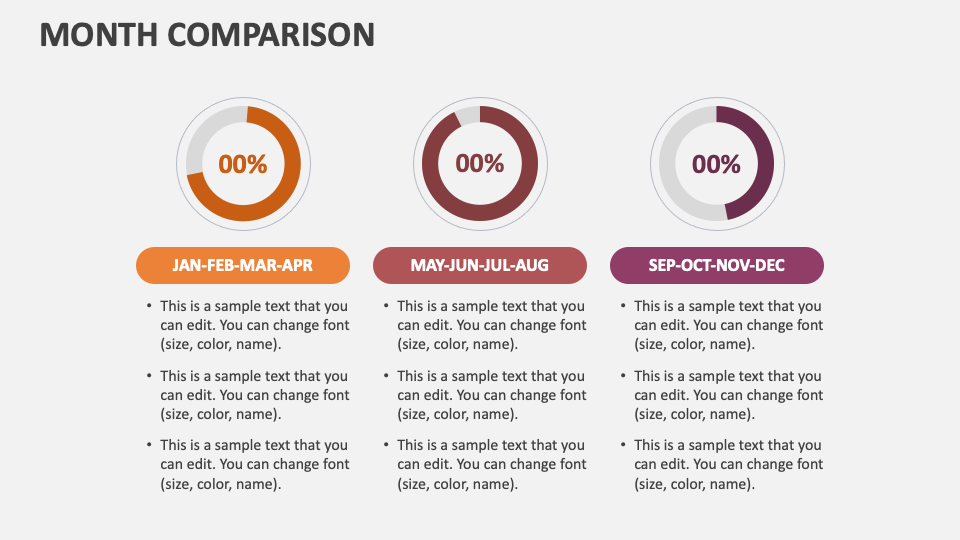
Leverage our Month Comparison presentation template for MS PowerPoint and Google Slides to depict the method of analyzing data or performance metrics over different months to identify trends, patterns, and changes within a specific timeframe.
This deck is ideal for marketing professionals and will help them represent the advertising campaign performance, website traffic, bounce rate, etc., over months. Sales executives can showcase the customer conversion rates, customer feedback scores, and more., on a quarterly basis. Project heads can illustrate the project's progression throughout the months. Business leaders can provide a comparative overview of the targets/milestones missed and achieved in the past few months.