
Optimization Icons
In stock
$5.00
item details (1 Editable Slide)
- Applications Supported: PowerPoint, Google Slides
- File Type: .pptx, Google Slides
- Aspect Ratio:16:9 (Wide Screen)
- Animation: No
Optimization Icons
Optimization Icons
(1 Editable Slide)
Related Products


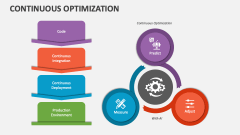
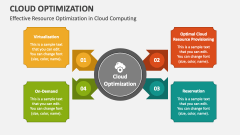
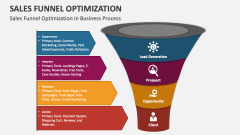
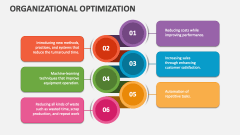
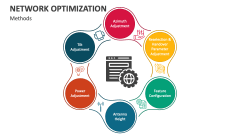
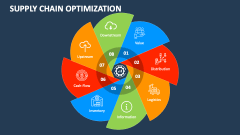
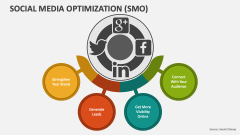
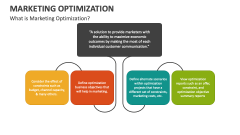
Our Optimization Icons are the perfect choice for MS PowerPoint and Google Slides presentations related to process improvement, cost reduction, streaming operation, and performance enhancement. The PPT comprises icons of a gear with a tick mark, revolving gears, and more.
Data analysts can use the icons to give a visual complement to their text about data modeling, machine learning, and statistical analysis. Engineers and business owners can use these icons to showcase topics such as ways to improve a system to increase efficiency, business/human capital/inventory optimization, and much more. These icons will help you draw your audience’s attention to the slide section depicting the benefits and advantages of the optimization process.