
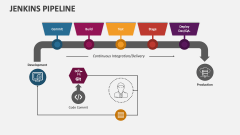
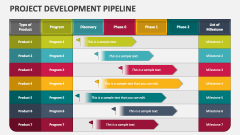
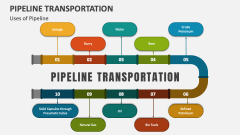
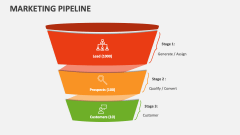
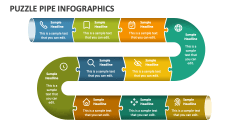
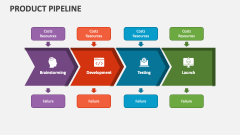
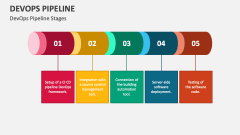
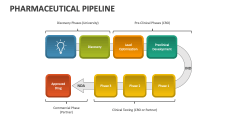
Pipe Diagram
In stock
$5.00
item details (8 Editable Slides)
- Applications Supported: PowerPoint, Google Slides
- File Type: .pptx, Google Slides
- Aspect Ratio:16:9 (Wide Screen)
- Animation: Yes
Pipe Diagram
Pipe Diagram
(8 Editable Slides)
Related Products
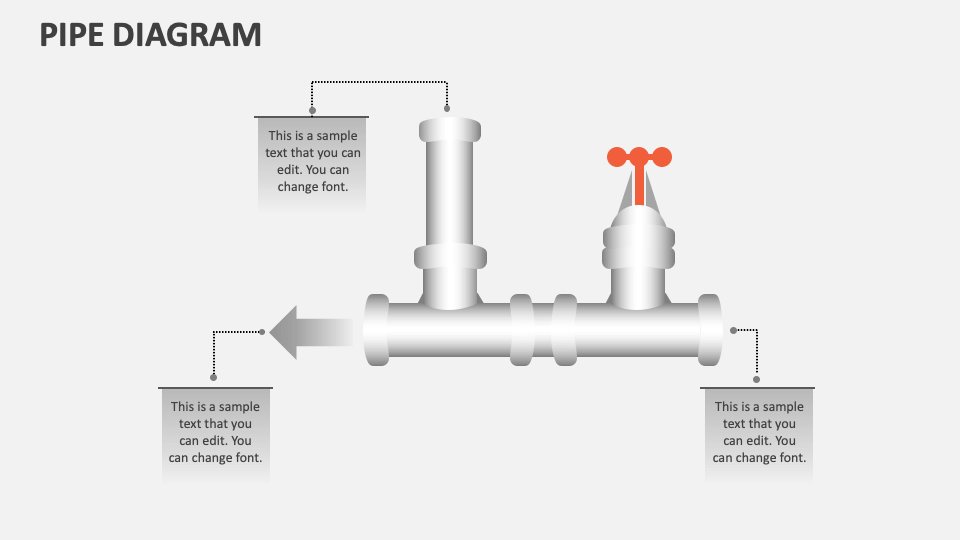
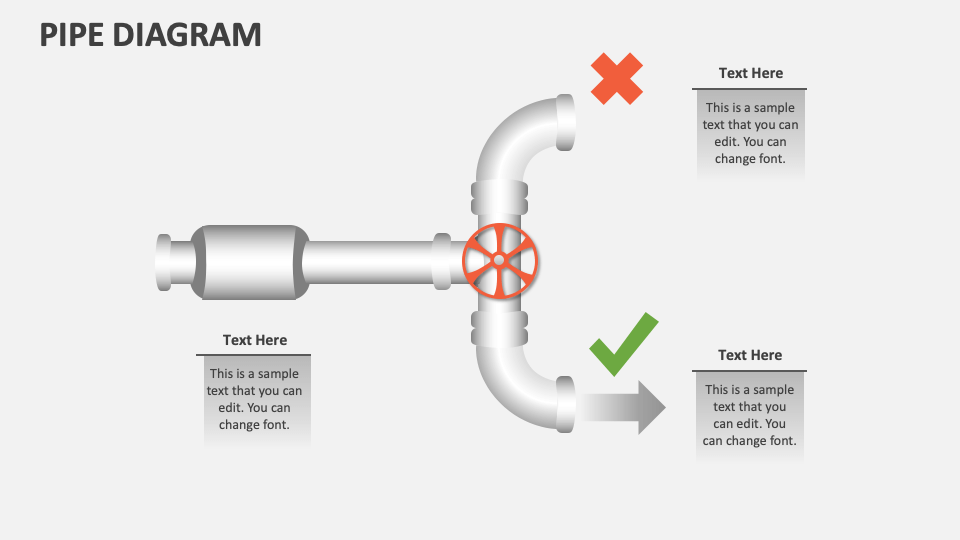
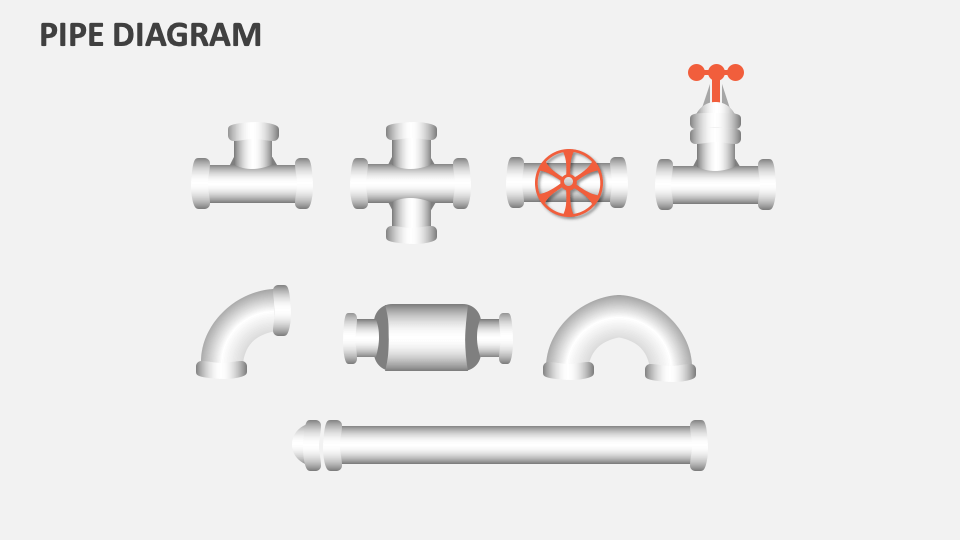
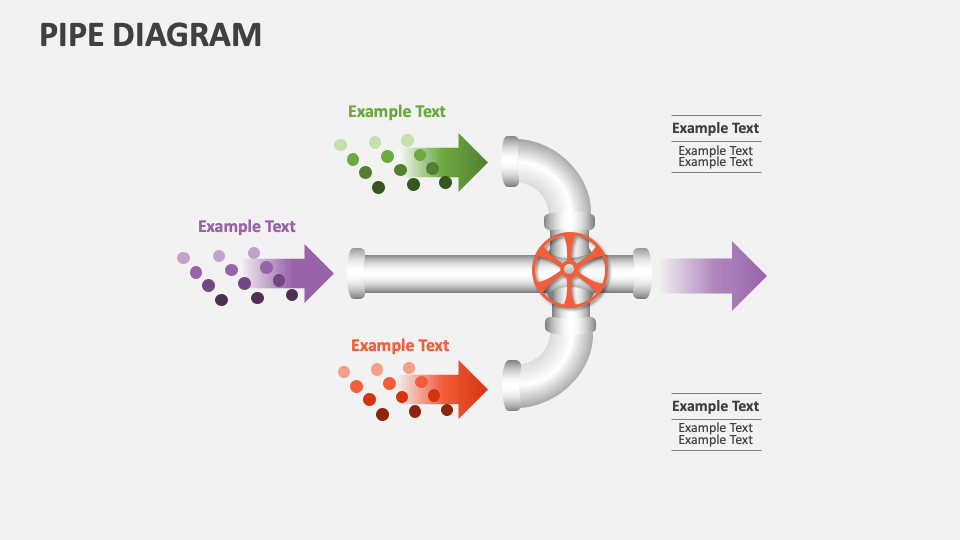
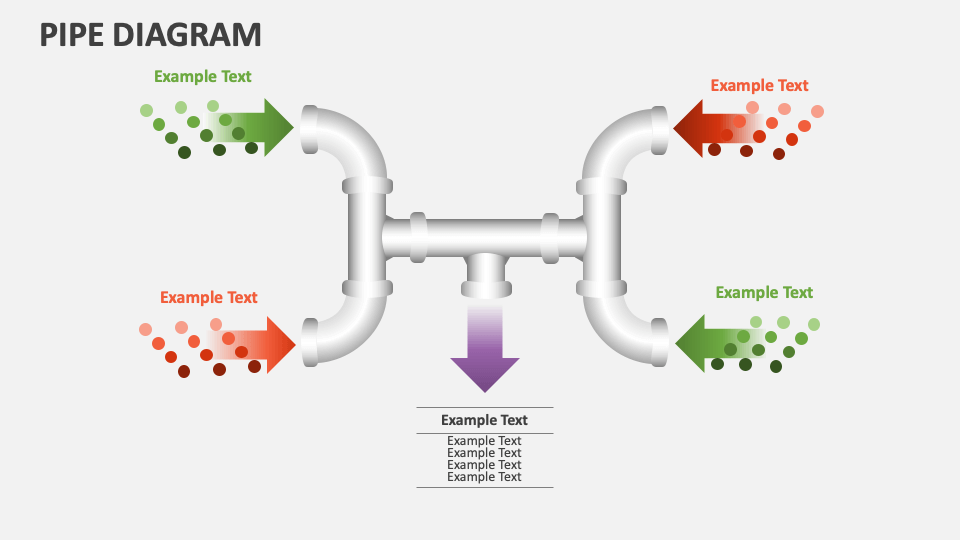
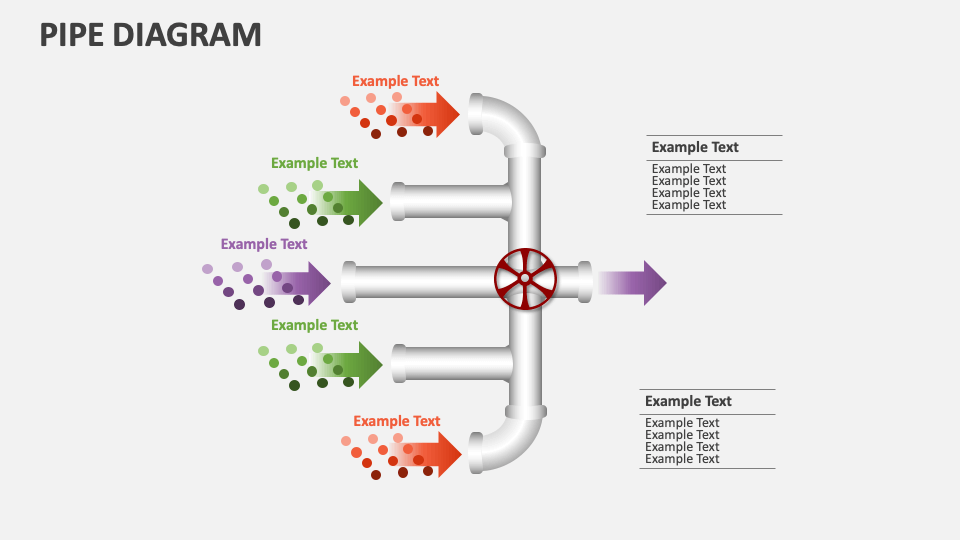
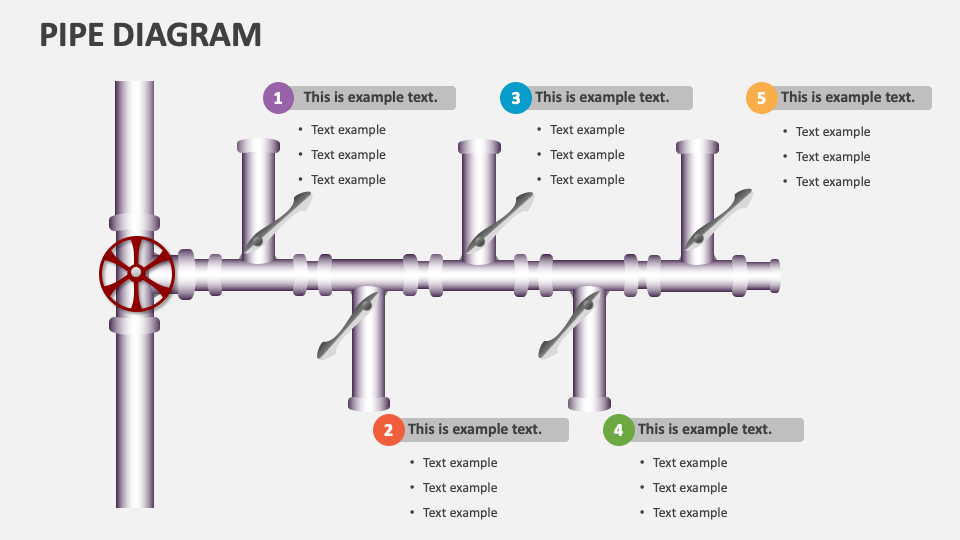
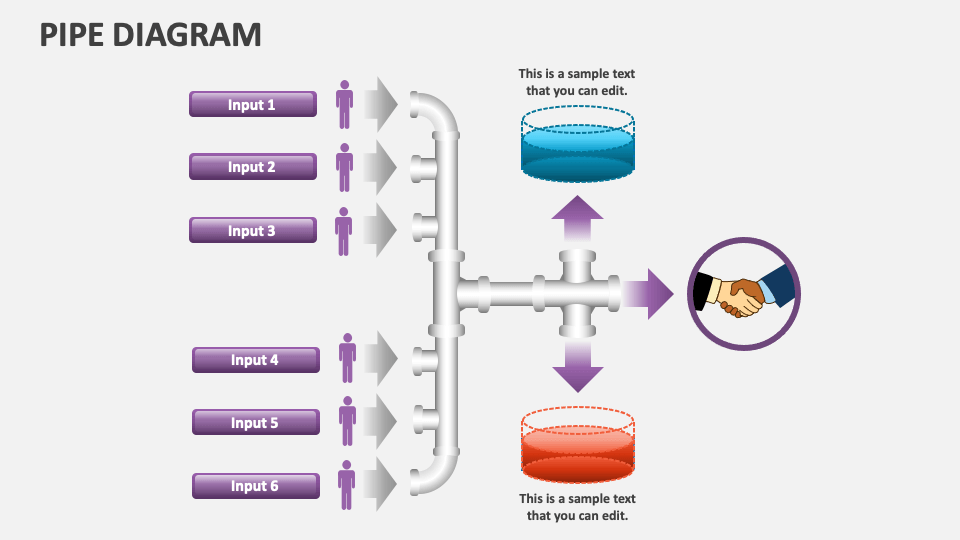
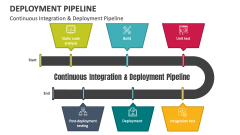
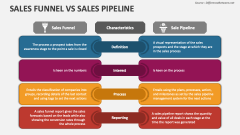
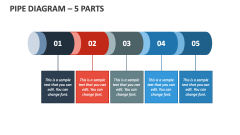
Our Pipe Diagram for MS PowerPoint and Google Slides is a perfect visual aid for depicting multiple projects in a pipeline, limitations and advantages of specific marketing techniques, different stages and touchpoints in the client journey, various ways to overcome a problem, and more.
Business leaders can use this template to showcase how different departments and teams collectively help achieve common organizational objectives. Brand managers and product heads can visualize the merits and demerits of their products and services. HR heads can illustrate the channels and processes through which employee feedback flows. In addition, you can present distinct outcomes of multiple inputs.