
Project Health Chart
In stock
$5.00
item details (1 Editable Slide)
- Applications Supported: PowerPoint, Google Slides
- File Type: .pptx, Google Slides
- Aspect Ratio:16:9 (Wide Screen)
- Animation: Yes
Project Health Chart
Project Health Chart
(1 Editable Slide)
Related Products
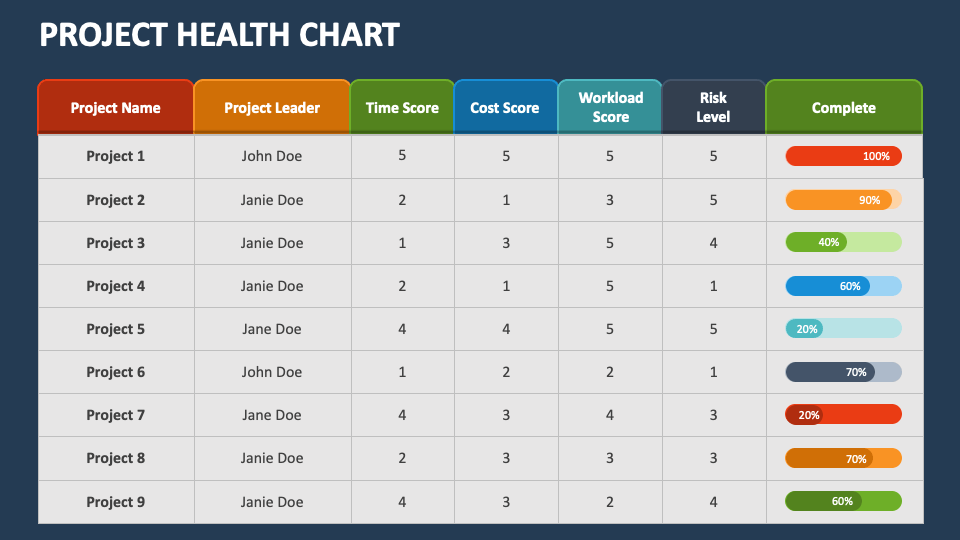
Take advantage of our Project Health Chart presentation graphic for MS PowerPoint and Google Slides to visualize the current status and progression of a project. You can explain how this chart includes metrics related to the project scope, schedule, budget, and more. Present your information in an easy-to-understand manner using our outstanding set!
Business leaders and project managers will find this slide helpful in depicting the key aspects of a project, i.e., Project’s Name, Leader, Time and Cost Score, etc. You can also highlight the key indicators that help the project team assess the project's health, identify underlying issues, and implement data-driven solutions to ensure project success.