




Quantity Icons
In stock
$5.00
item details (1 Editable Slide)
- Applications Supported: PowerPoint, Google Slides
- File Type: .pptx, Google Slides
- Aspect Ratio:16:9 (Wide Screen)
- Animation: No
Quantity Icons
Quantity Icons
(1 Editable Slide)
Related Products







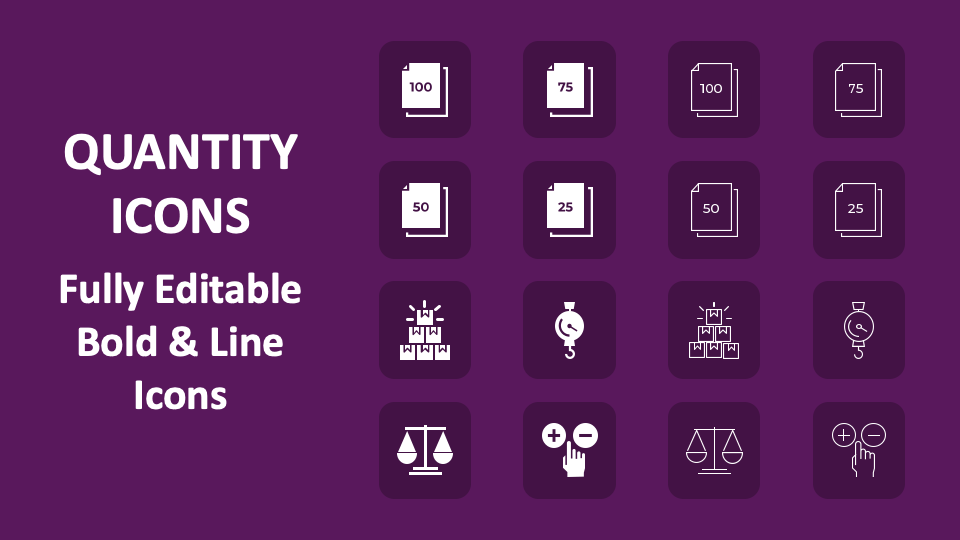
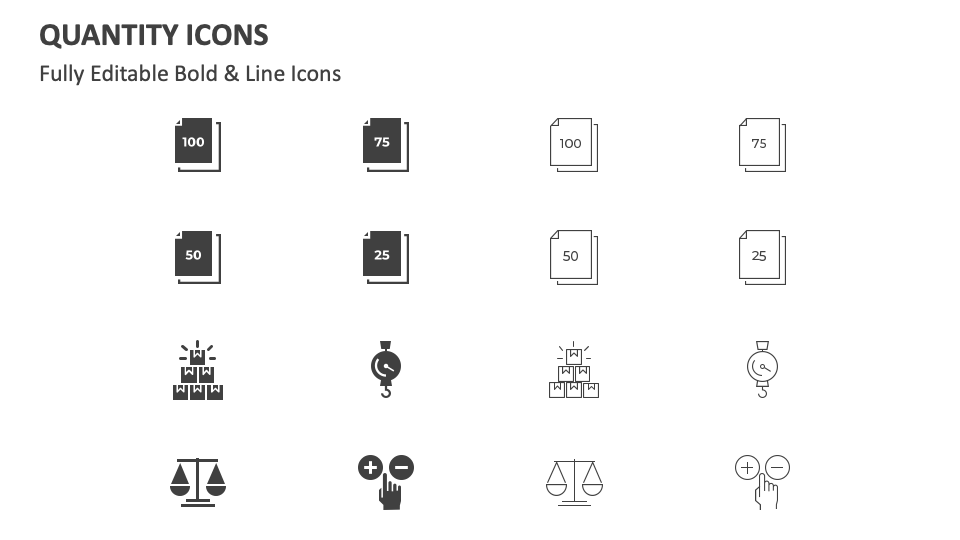
Download our Quantity Icons for MS PowerPoint and Google Slides presentations to visualize information on inventory management, logistics, and other numerical-based data. The slide features icons of documents with numbers 100/50/75/25, a weighing scale, a hand with negative and positive buttons, cardboard boxes, etc.
Data analysts can use these wonderful icons to strengthen text related to data analysis and important quantitative information such as sales figures, revenue, and customer demographics. By using these icons in their presentations, inventory and supply chain managers can help their audience understand the formulas for calculating the stock prerequisites, the number of products in stock, and the number of items shipped and received.