
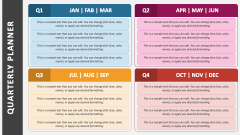
Quarterly Comparison Table
In stock
$5.00
item details (2 Editable Slides)
- Applications Supported: PowerPoint, Google Slides
- File Type: .pptx, Google Slides
- Aspect Ratio:16:9 (Wide Screen)
- Animation: Yes
Quarterly Comparison Table
Quarterly Comparison Table
(2 Editable Slides)
Related Products
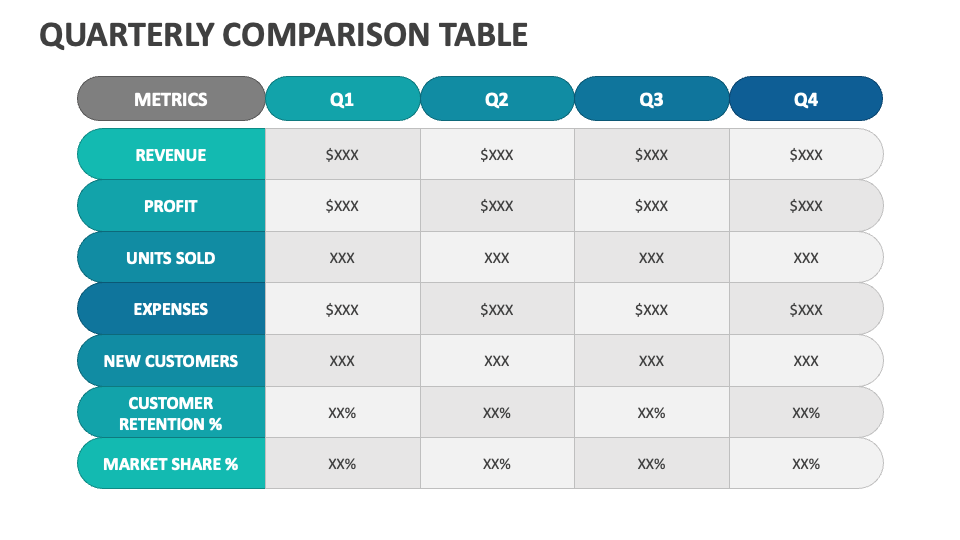
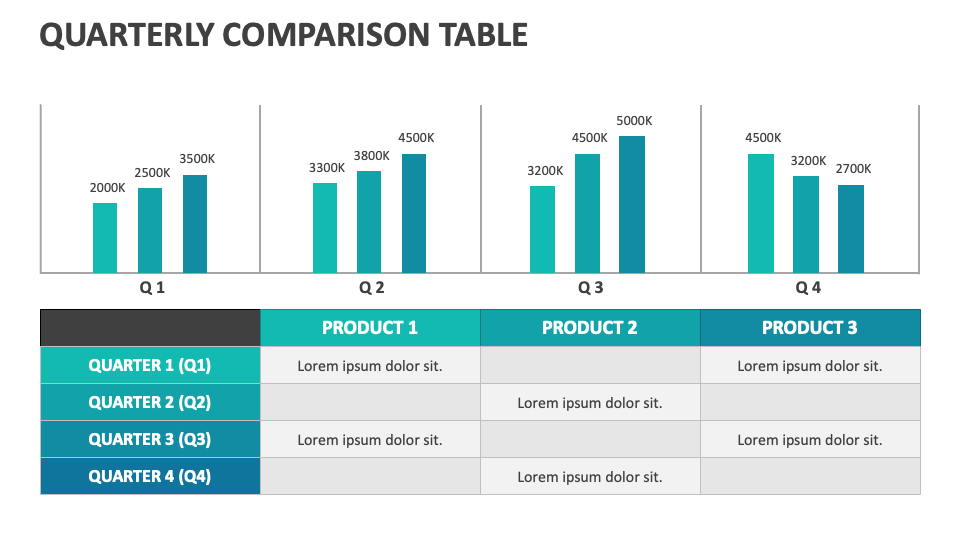
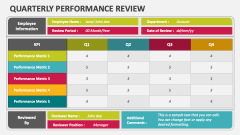
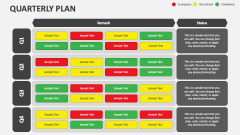
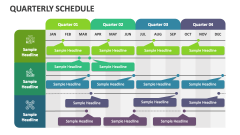
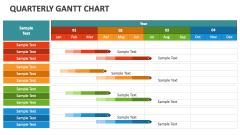
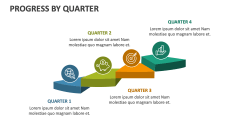
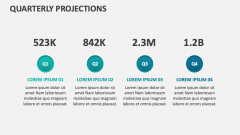
This Quarterly Comparison Table presentation template for MS PowerPoint and Google Slides is an ideal visual aid to portray a quarter-wise comparison of sales by region or product. The bar graphs and table illustrations in the slides make it easy for the audience to interpret the data. Grab it without a second thought!
Team leads and HR managers can use this deck to present a comparison of an individual team member’s performance over the quarters to top management, helping them make appraisal-related decisions. Sales managers can display a quarterly comparison of sales based on various metrics, such as revenue, profit, units sold, market share, etc. Product managers can use this set to present a comparison of two or more products for informed decision-making.