
Spider Diagram
In stock
$5.00
item details (8 Editable Slides)
- Applications Supported: PowerPoint, Google Slides
- File Type: .pptx, Google Slides
- Aspect Ratio:16:9 (Wide Screen)
- Animation: Yes
Spider Diagram
Spider Diagram
(8 Editable Slides)

Related Products

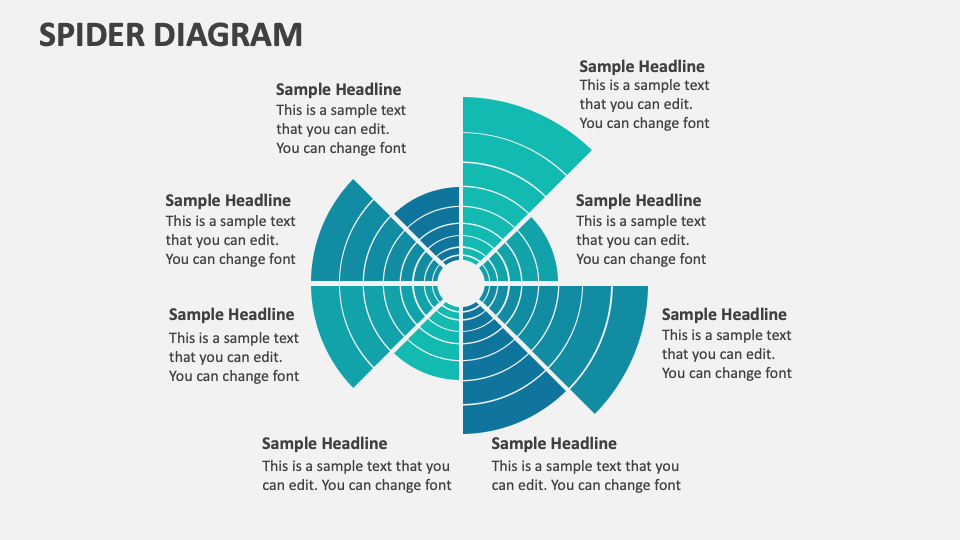
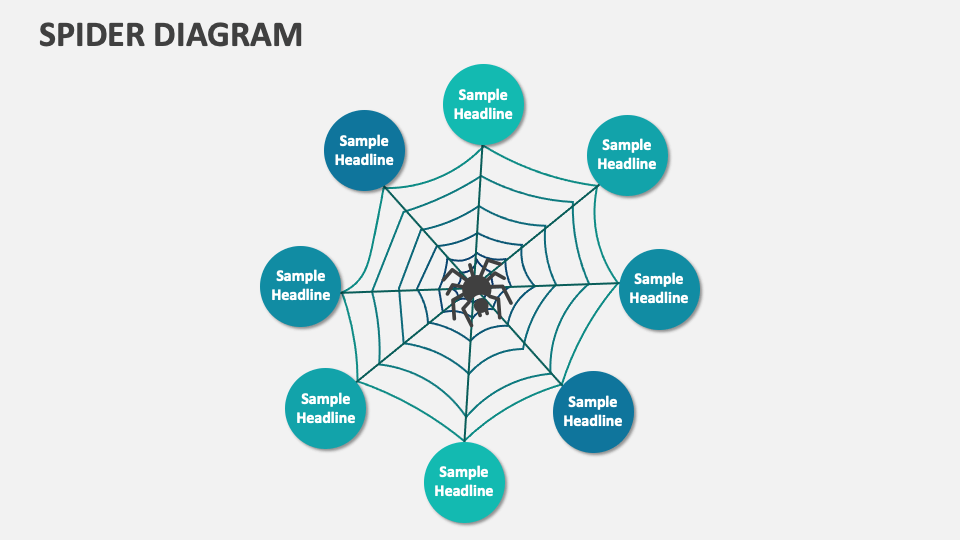
Grab our visually stimulating Spider Diagram presentation template to depict topics like key factors or areas critical to a business strategy, different project phases or aspects, problem-solving methods, 8 Ms in manufacturing, and more. Designed for MS PowerPoint and Google Slides, this deck will help you structure and present detailed points easily.
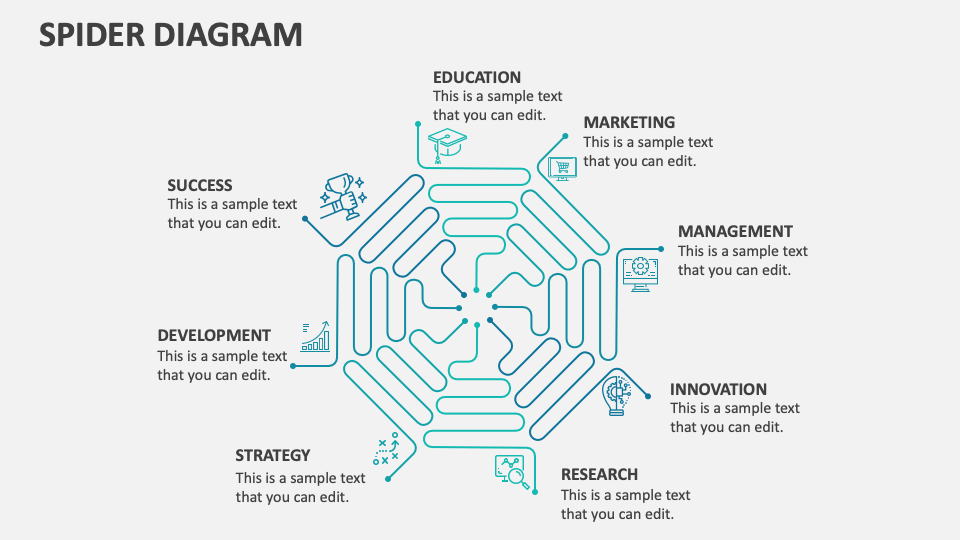
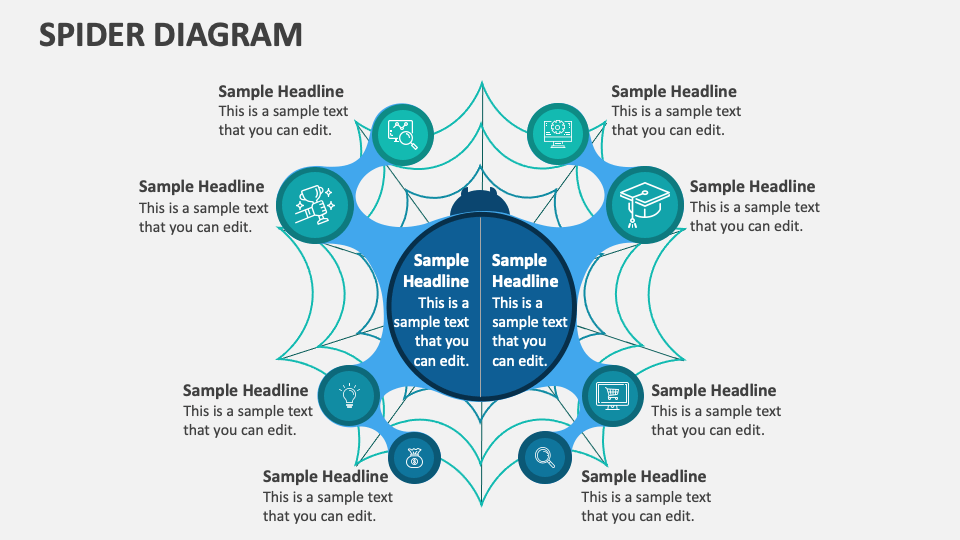
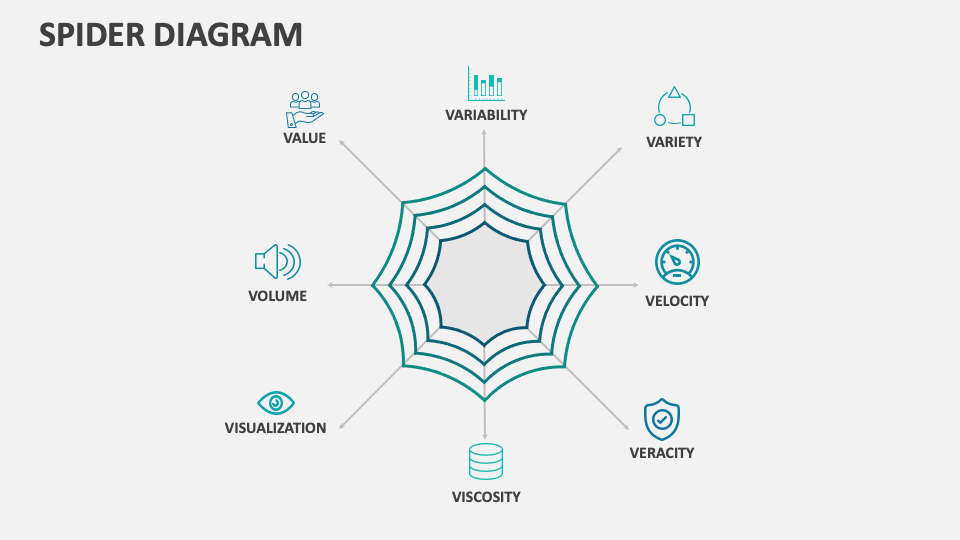
Market analysts can illustrate market segments, emerging market trends, influential factors affecting consumer behavior, and more. Big data experts and data scientists can shed light on the 8 Vs of big data. Sales executives can highlight the key features of their products, important touch points in a consumer journey, etc. Marketing heads can showcase the elements of the 8 Ps of marketing. IT heads can use this set to visualize multiple components of the IT infrastructure.