
Stacked Venn Diagram
In stock
$5.00
item details (9 Editable Slides)
- Applications Supported: PowerPoint, Google Slides
- File Type: .pptx, Google Slides
- Aspect Ratio:16:9 (Wide Screen)
- Animation: Yes
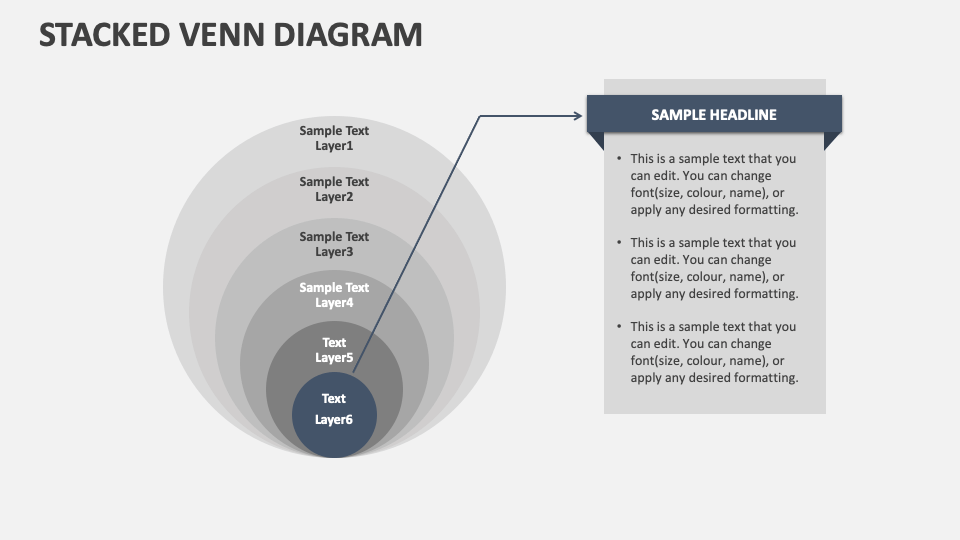
Stacked Venn Diagram
Stacked Venn Diagram
(9 Editable Slides)
Related Products
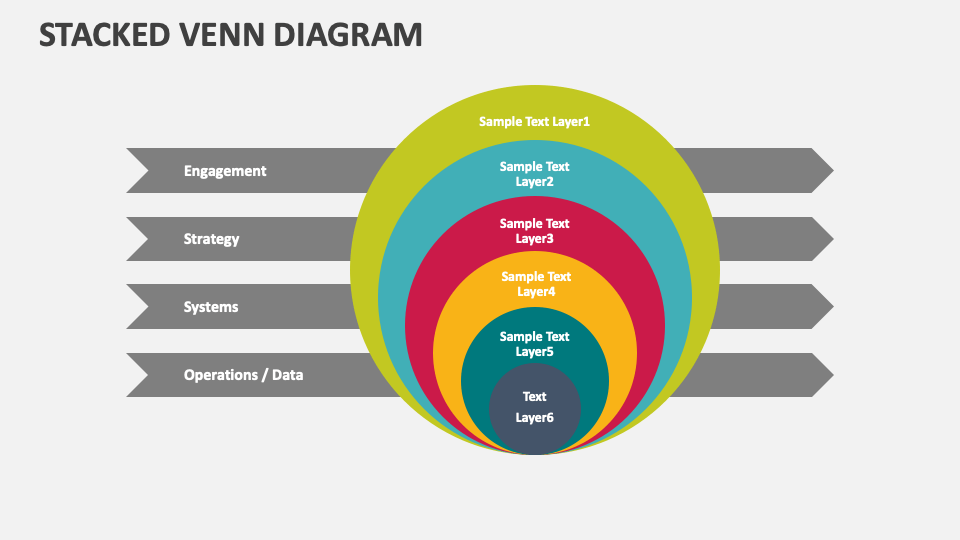
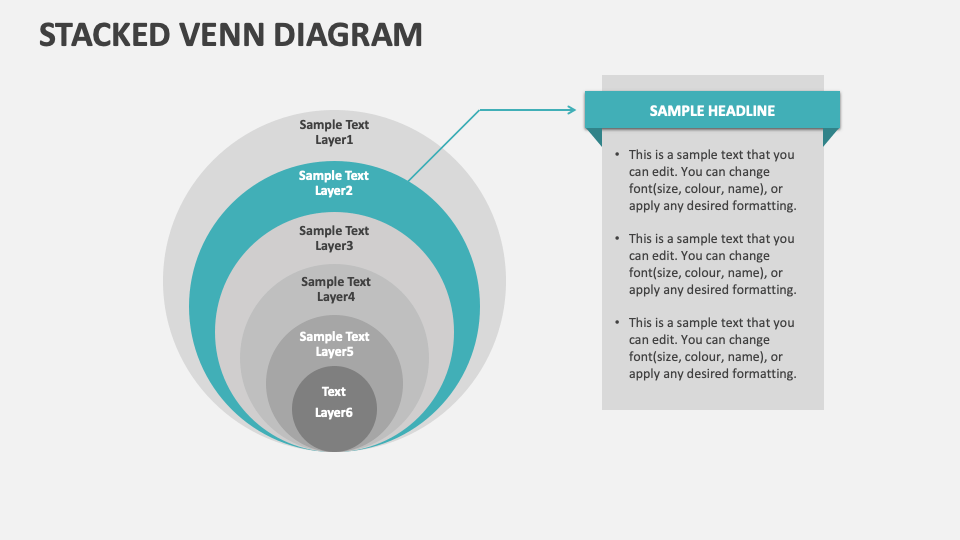
Download our Stacked Venn Diagram for MS PowerPoint and Google Slides to showcase the total addressable market, layers of atmosphere, and more. Present confidently with our striking template and enhance user engagement!
IT professionals and software developers can use this deck to depict the phases of SDLC, the digital transformation process, and more. Business leaders can shed light on the growth stages of a business, core teams/members of the organization and their primary responsibilities, etc. Sales heads can visualize the expansion of the target market geographically from local to regional to global markets, different customer groups, etc. Educators can include these slides in their educational presentations to illustrate layers of soil and more.