
Tree Diagram
In stock
$5.00
item details (8 Editable Slides)
- Applications Supported: PowerPoint, Google Slides
- File Type: .pptx, Google Slides
- Aspect Ratio:16:9 (Wide Screen)
- Animation: Yes
Tree Diagram
Tree Diagram
(8 Editable Slides)
Related Products


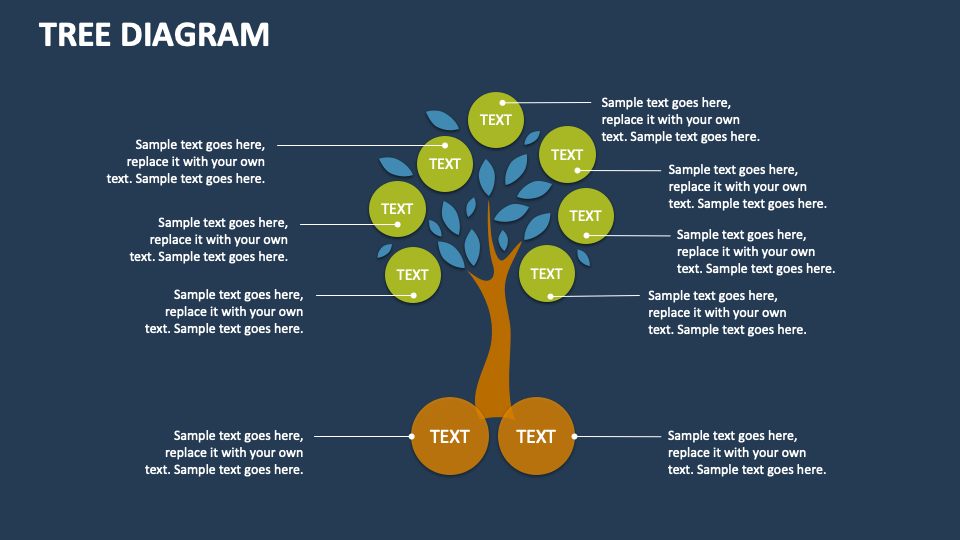
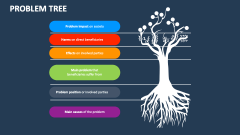
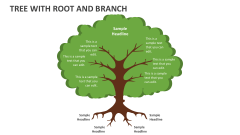
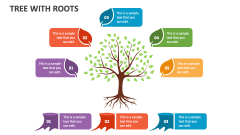
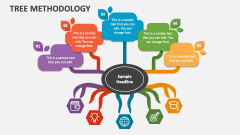
Get our Tree Diagram for MS PowerPoint and Google Slides to illustrate cause-and-effect relationships, root-cause analysis, organizational hierarchy, decision-making processes and outcomes, and more. These slide designs enable easy summarization of lengthy content into concise points and ideas, ensuring clarity and comprehension for the audience.
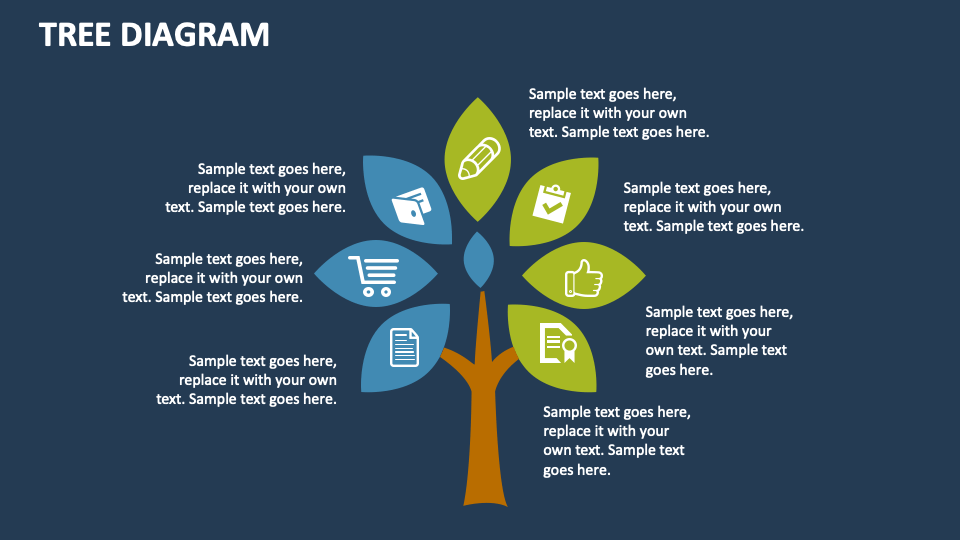
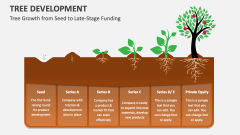
Business development executives can utilize this template to present their firm's subsidiaries, clientele, service offerings, and other crucial information. Market and business analysts can depict the key players of a particular industry, as well as their market share. HR heads can include these slides in their presentations to familiarize new recruits with the chain of command in their teams and other departments. Sales heads can visualize the classification of products or services into categories and subcategories, different forecasting methods used to predict future sales performance, etc.