
Waterfall diagram
In stock
$5.00
item details (10 Editable Slides)
- Applications Supported: PowerPoint, Google Slides
- File Type: .pptx, Google Slides
- Aspect Ratio:16:9 (Wide Screen)
- Animation: Yes
Waterfall diagram
Waterfall diagram
(10 Editable Slides)
Related Products

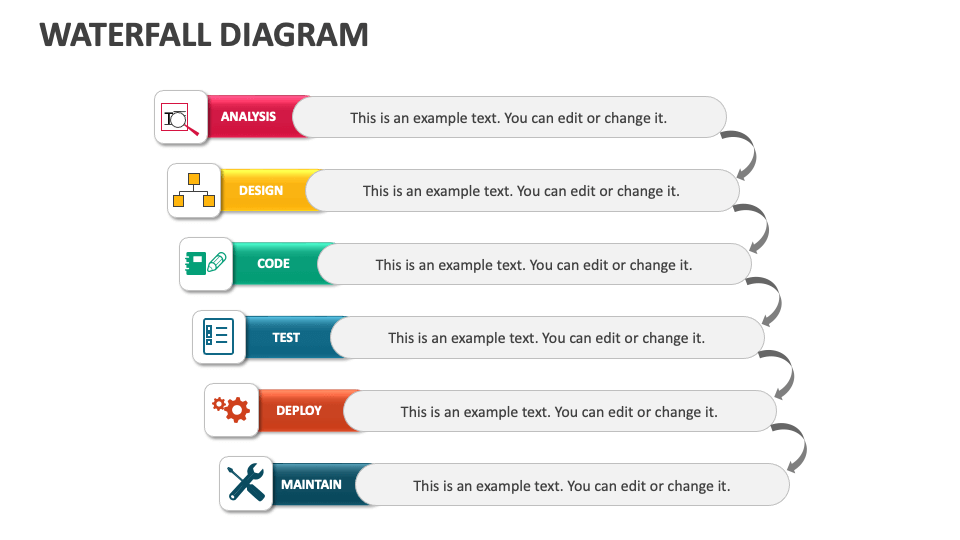
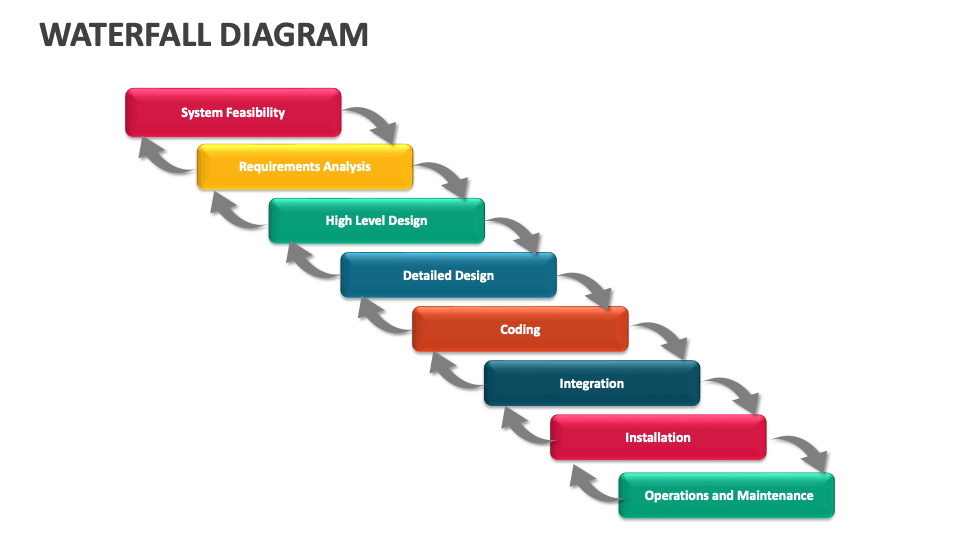
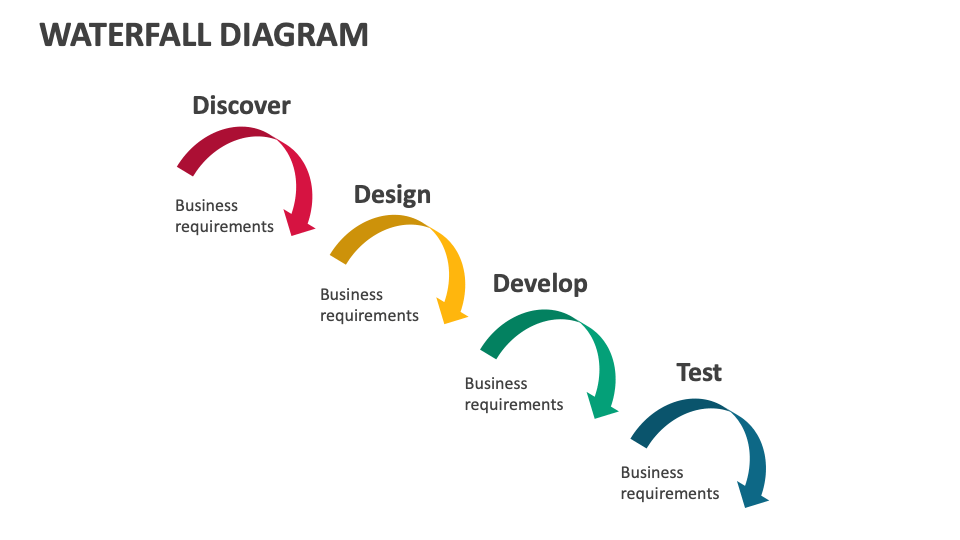
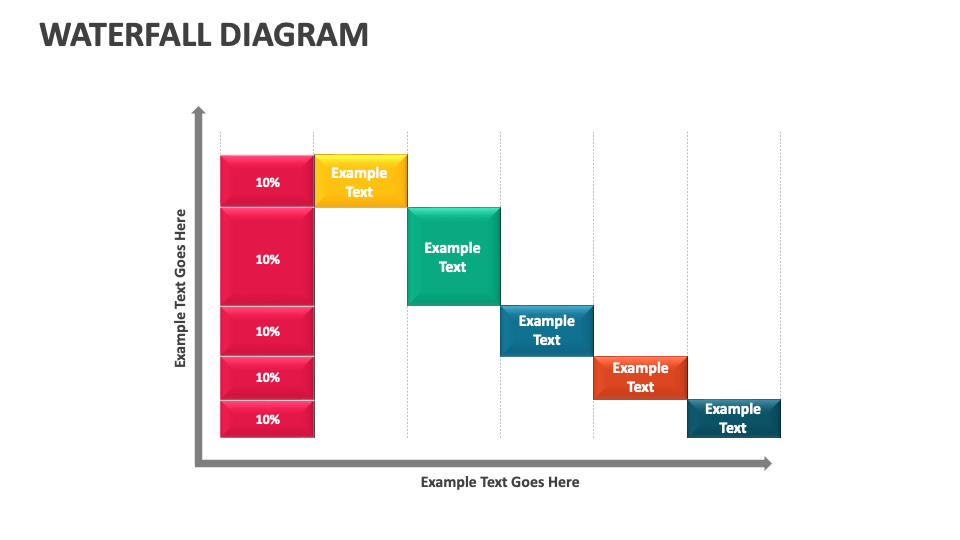
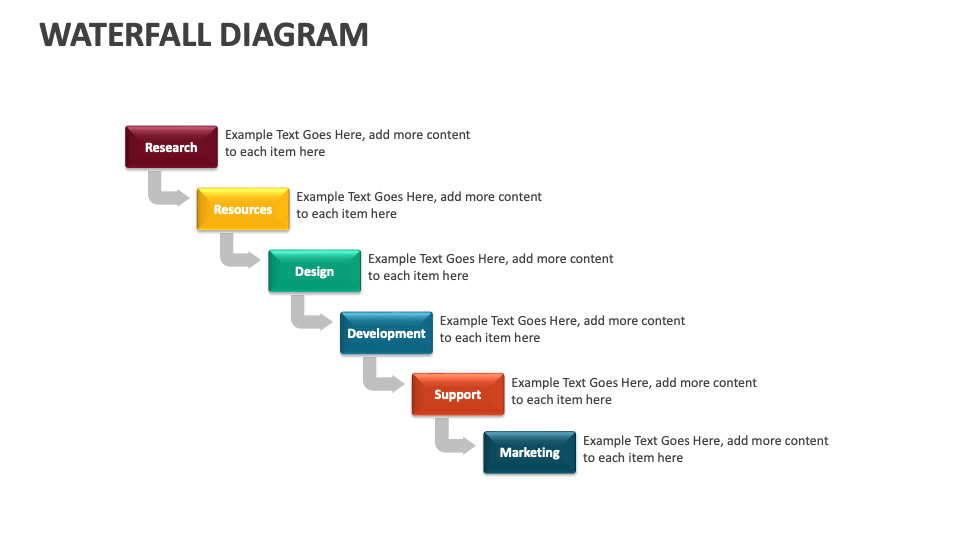
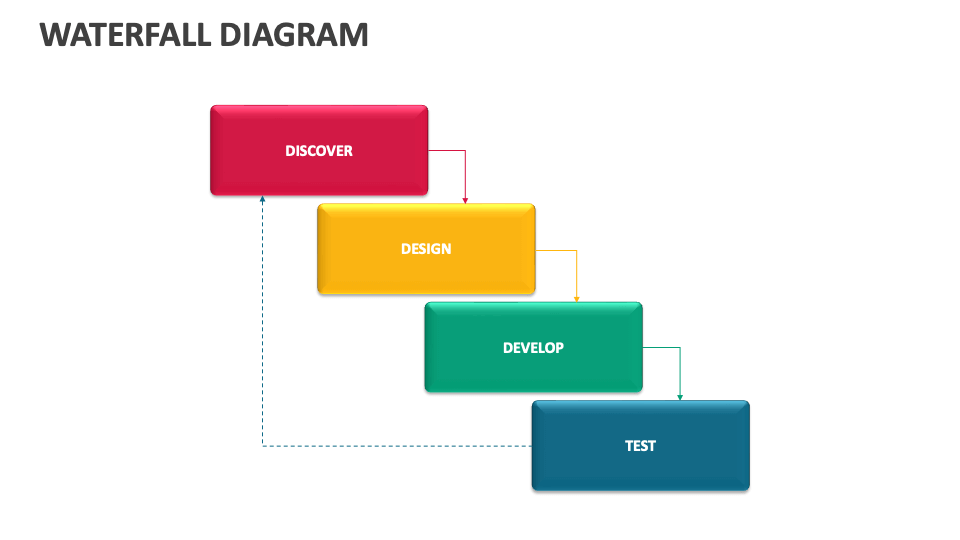
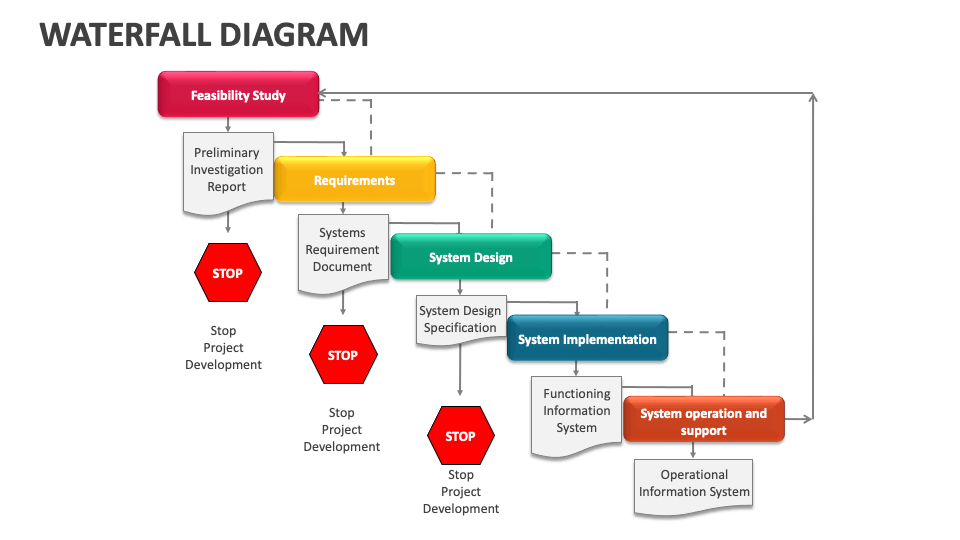
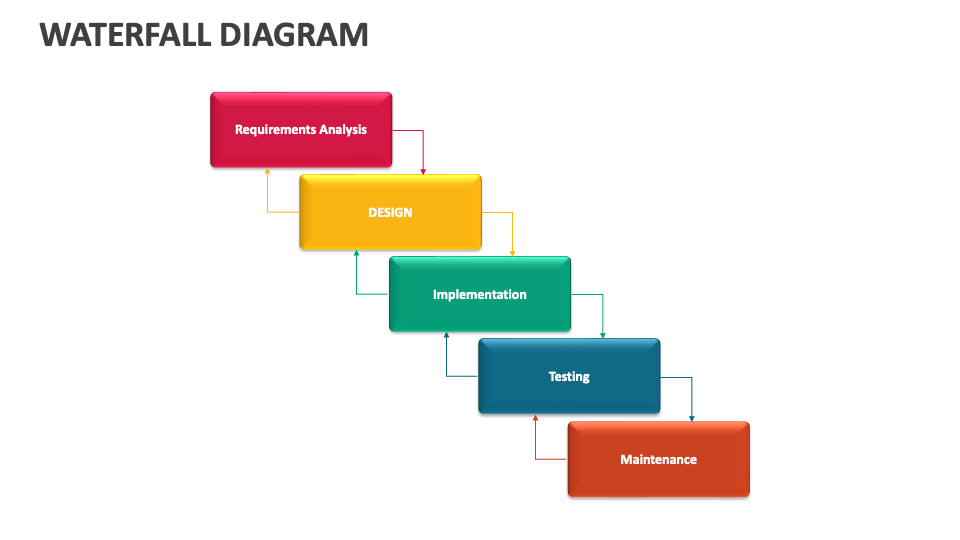
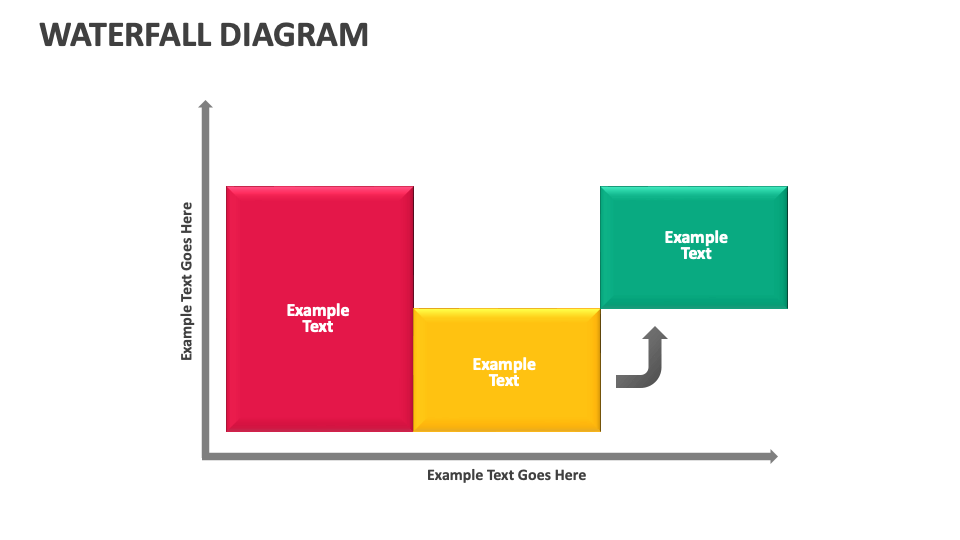
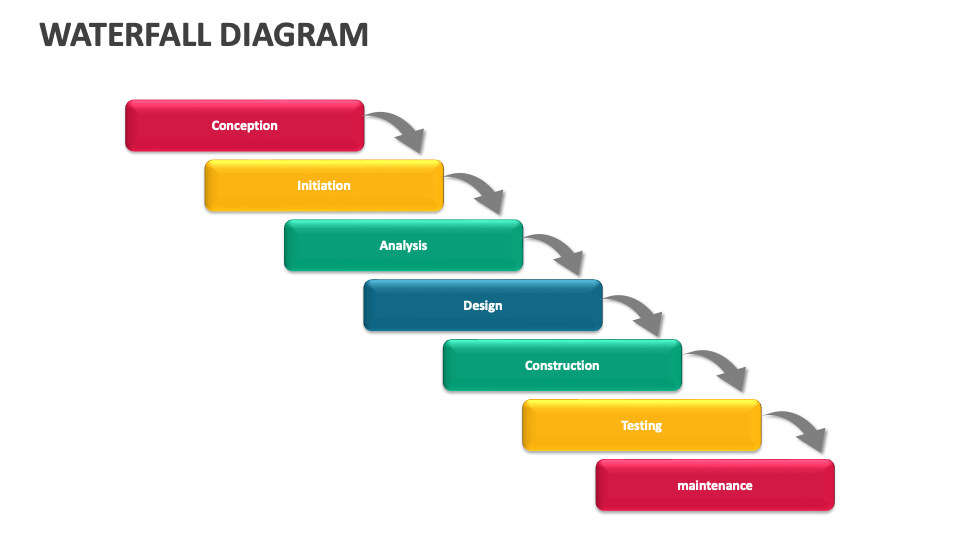
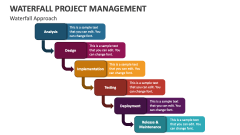
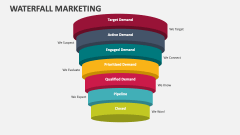
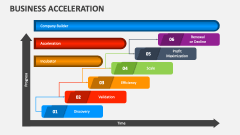
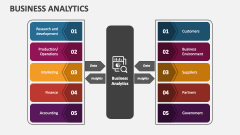
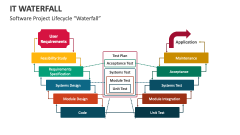
Our Waterfall Diagram for MS PowerPoint and Google Slides is an ideal visual aid for depicting how the consecutive introduction of negative and positive values affects the initial value. Download this professionally designed deck now and make your presentations unique and memorable.
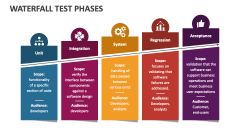
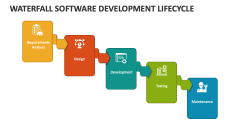
Software developers and testers can use this template to showcase the stages and activities of the waterfall testing method. Project heads can visualize the percentage impact of various risks on the overall project or business scenario. You can also use the waterfall diagrams in presentations related to data or performance analysis, inventory analysis, quantitative analysis, and more.