
Bubbles Cluster Diagram
In stock
$5.00
item details (11 Editable Slides)
- Applications Supported: PowerPoint, Google Slides
- File Type: .pptx, Google Slides
- Aspect Ratio:16:9 (Wide Screen)
- Animation: Yes
Bubbles Cluster Diagram
Bubbles Cluster Diagram
(11 Editable Slides)

Related Products


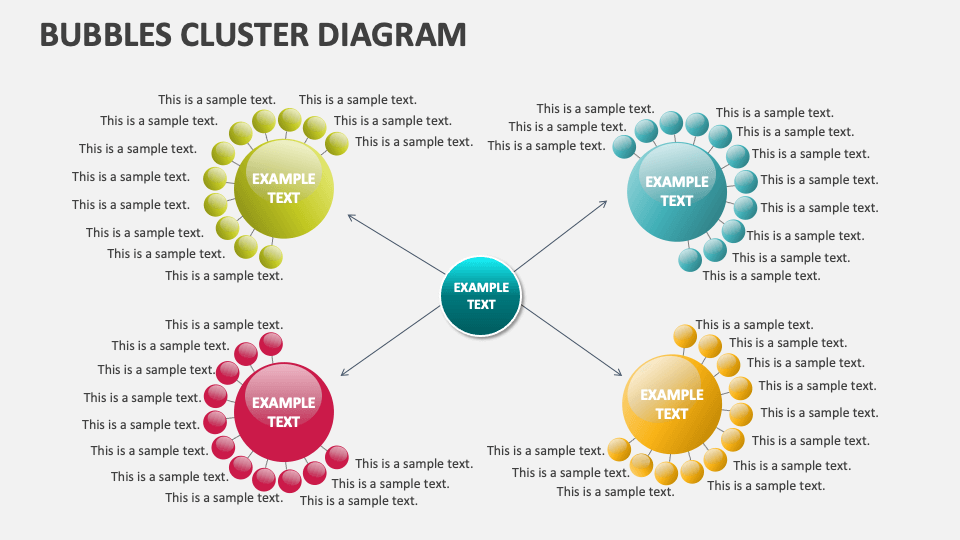
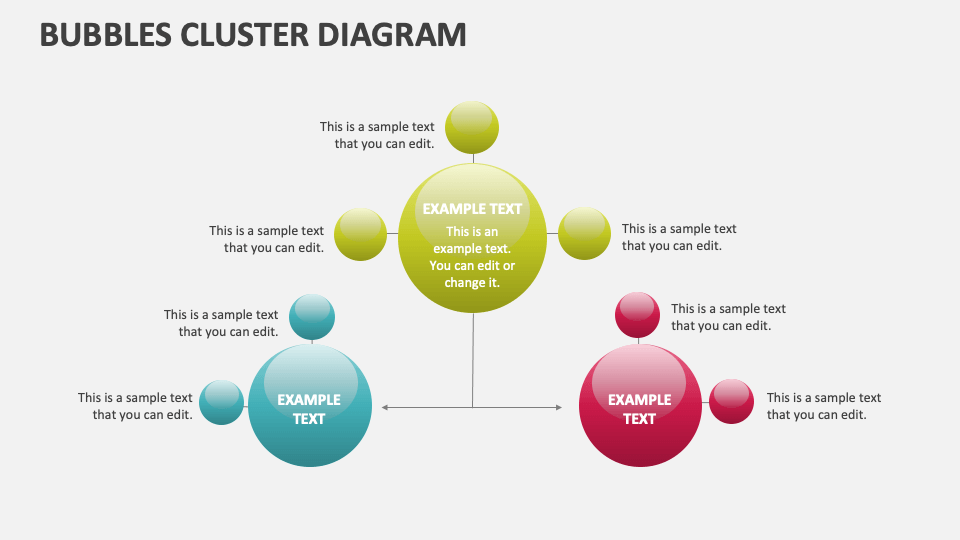
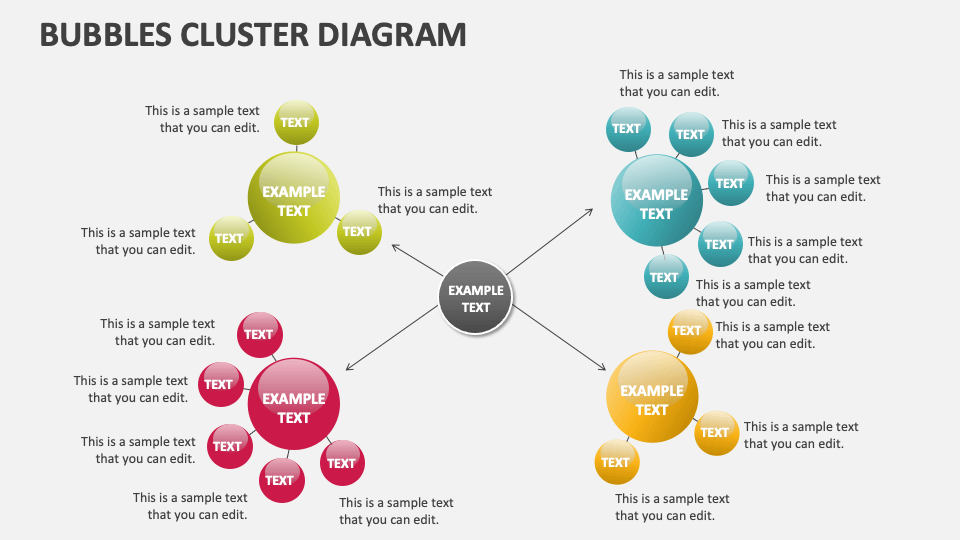
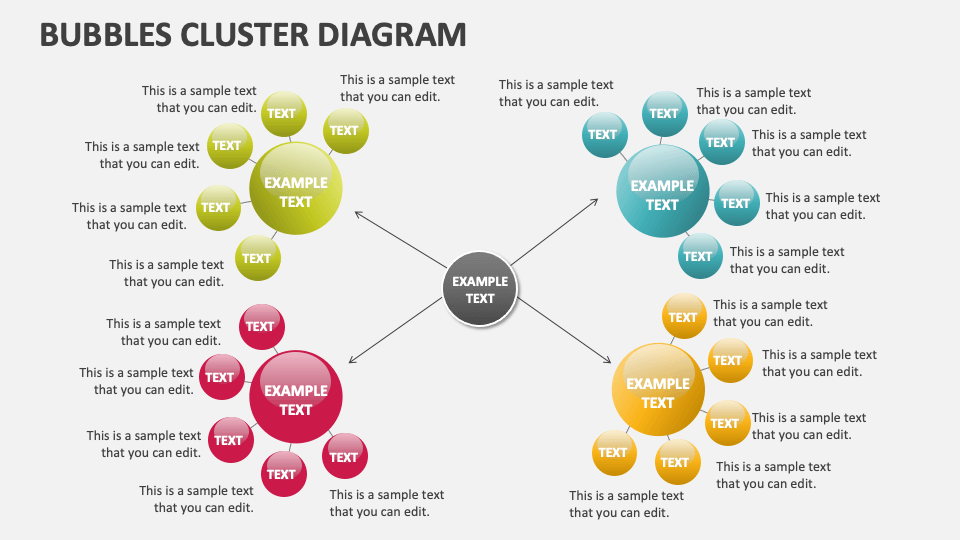
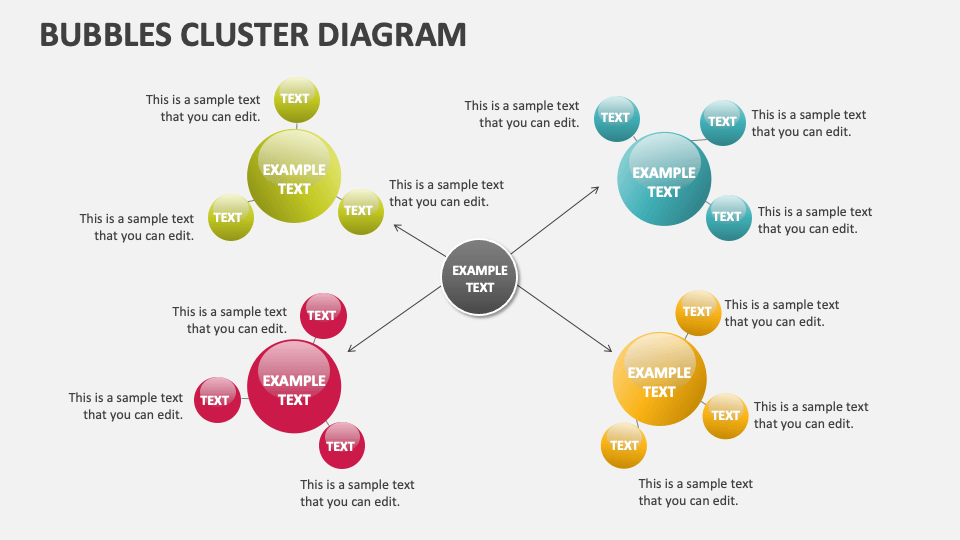
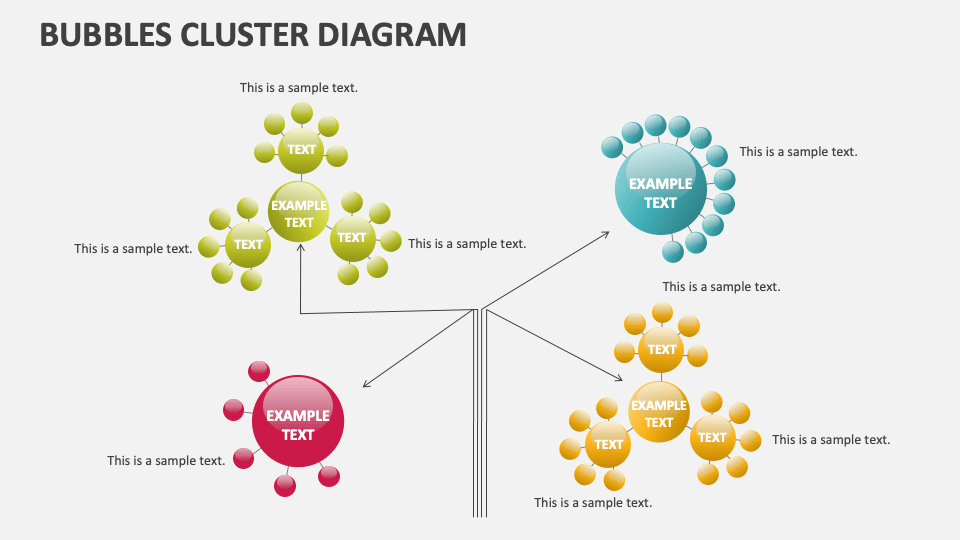
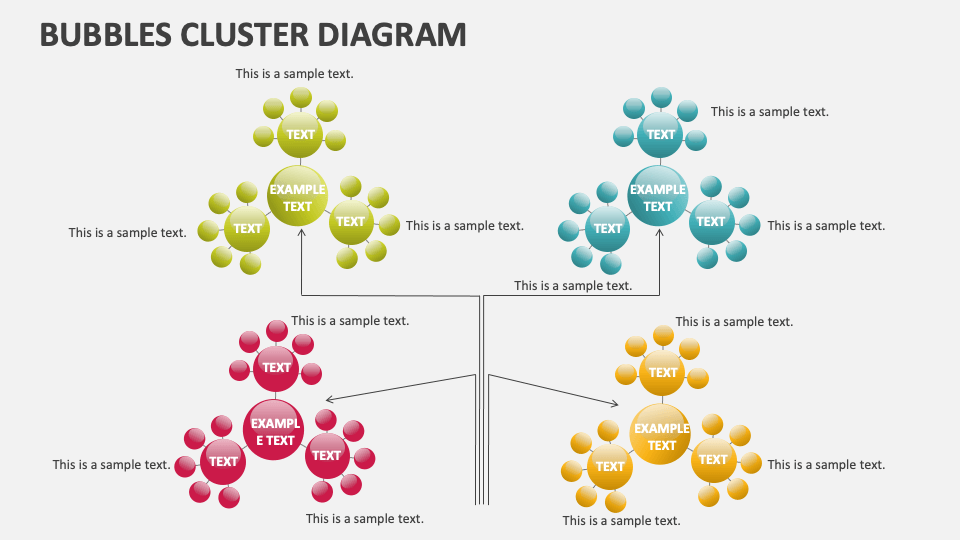
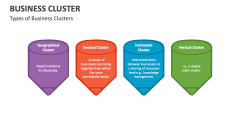
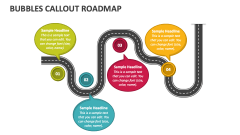
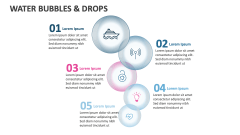
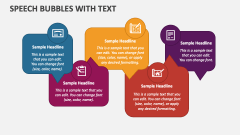
Download our Bubbles Cluster Diagram for MS PowerPoint and Google Slides to depict the topics like subcategories of an idea, product features, meeting agendas, connection between project phases and activities, potential risks and their impacts, and more. The template is ideal for presenting points supporting a central idea.
Business leads can capitalize on this set to illustrate the findings of PEST and SWOT analysis. Marketing heads and sales leaders can showcase customer segments based on various factors. Team leaders can shed light on the roles and functions of different team members. HR heads can demonstrate the objectives and key functions of various departments in an organization. Adequate space is available for text insertion, allowing you to present personalized content seamlessly.