
Bubble Chart (Data Driven)
In stock
$5.00
item details (9 Editable Slides)
- Applications Supported: PowerPoint, Google Slides
- File Type: .pptx, Google Slides
- Aspect Ratio:16:9 (Wide Screen)
- Animation: Yes
Bubble Chart (Data Driven)
Bubble Chart (Data Driven)
(9 Editable Slides)
Related Products

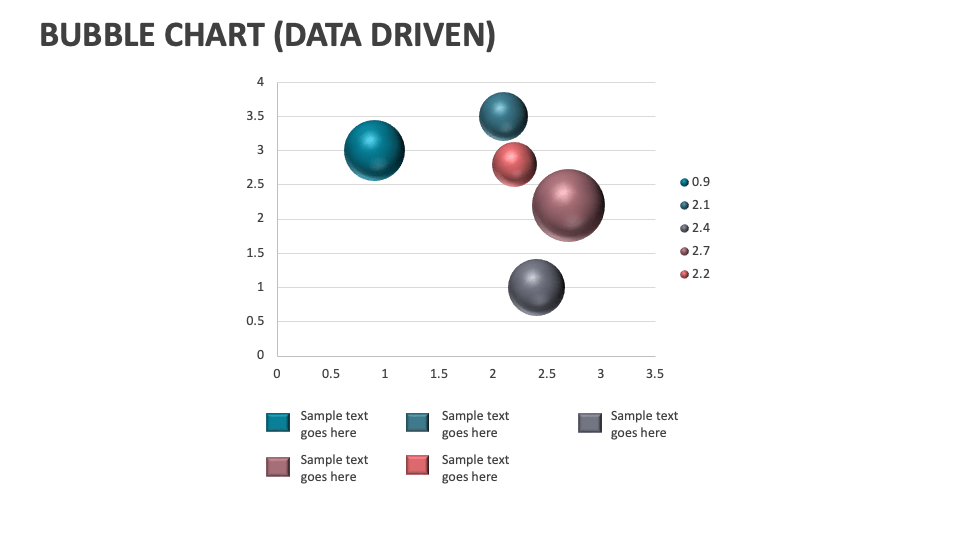
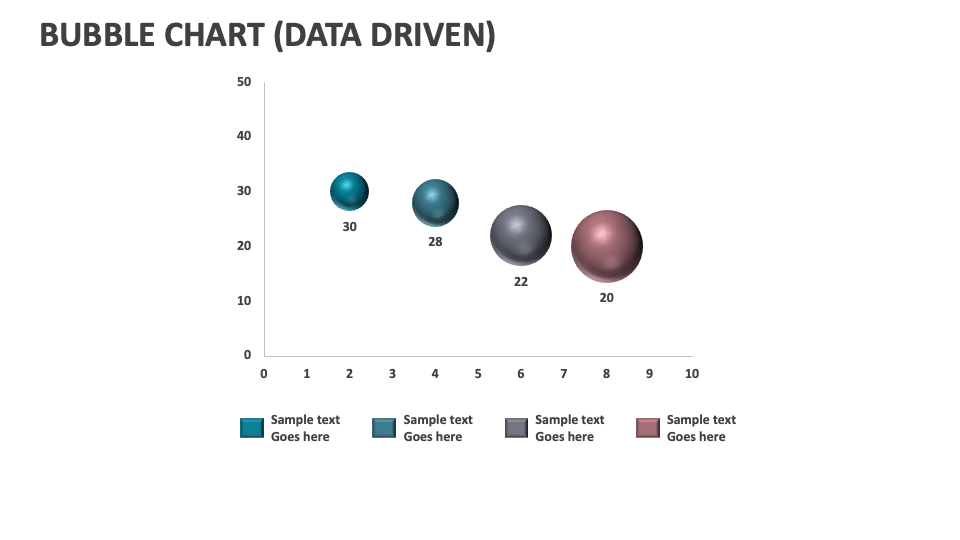
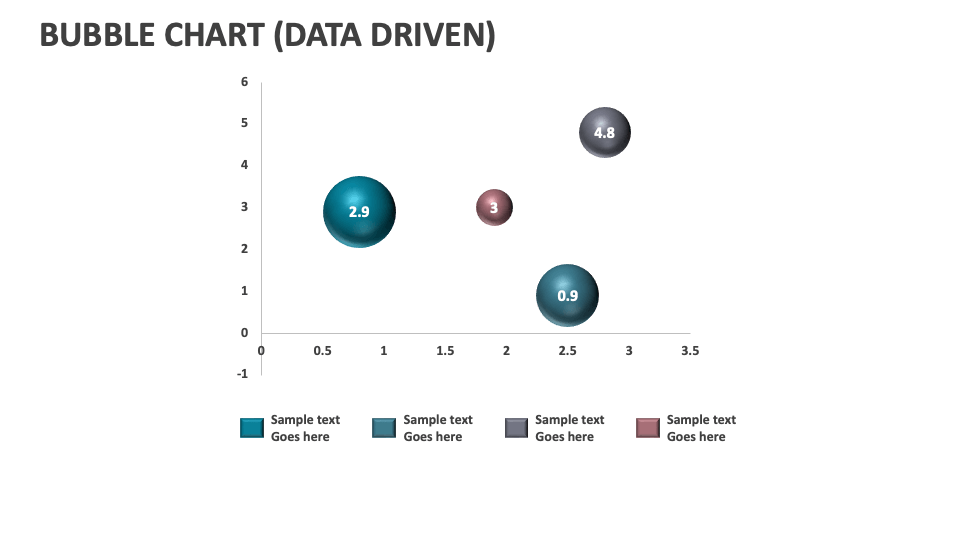
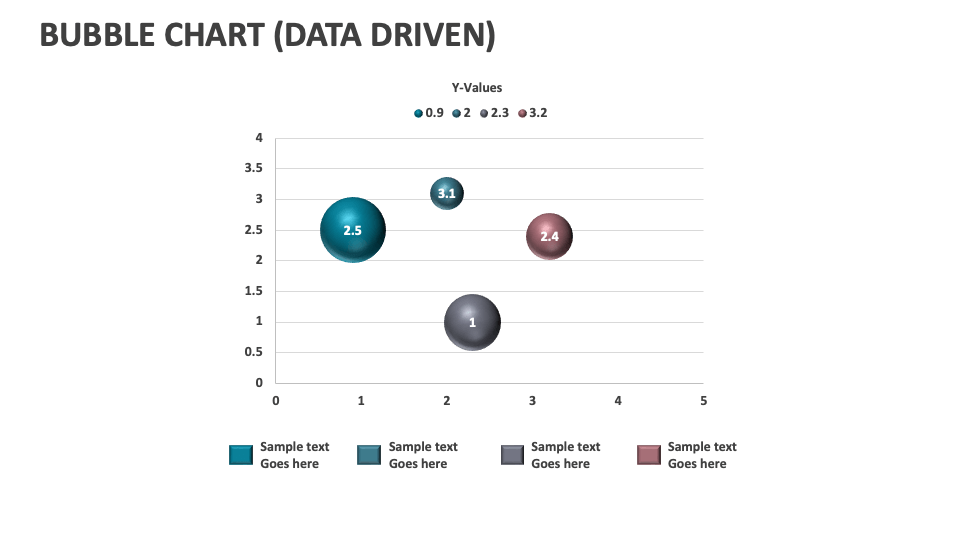
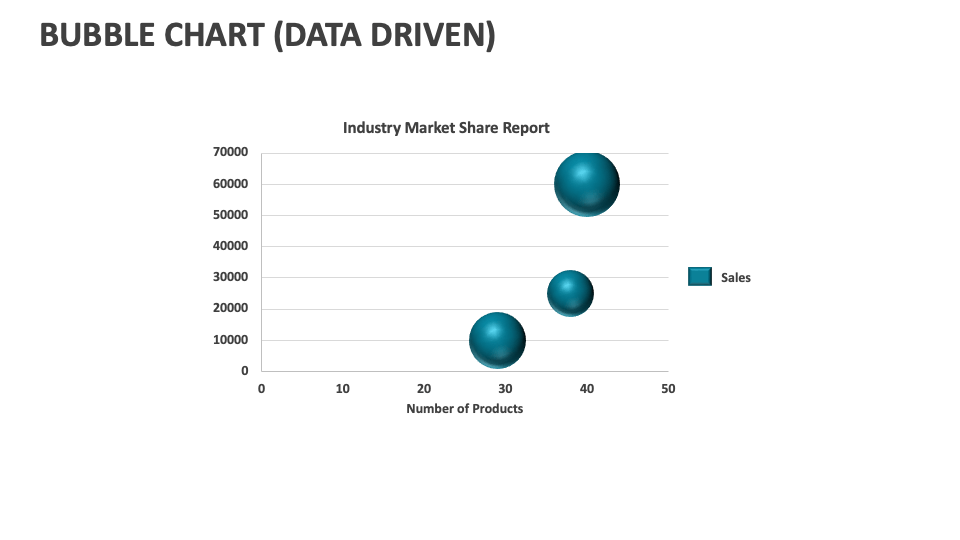
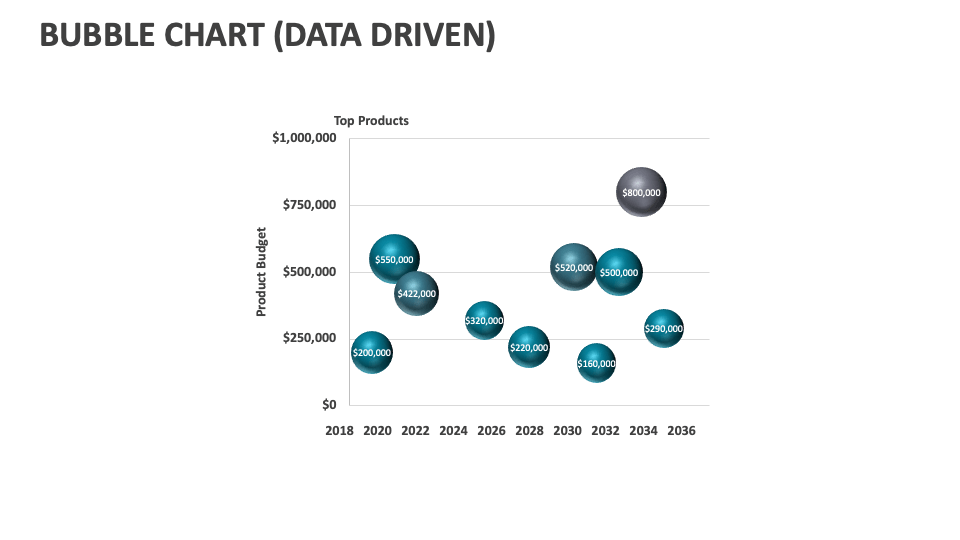
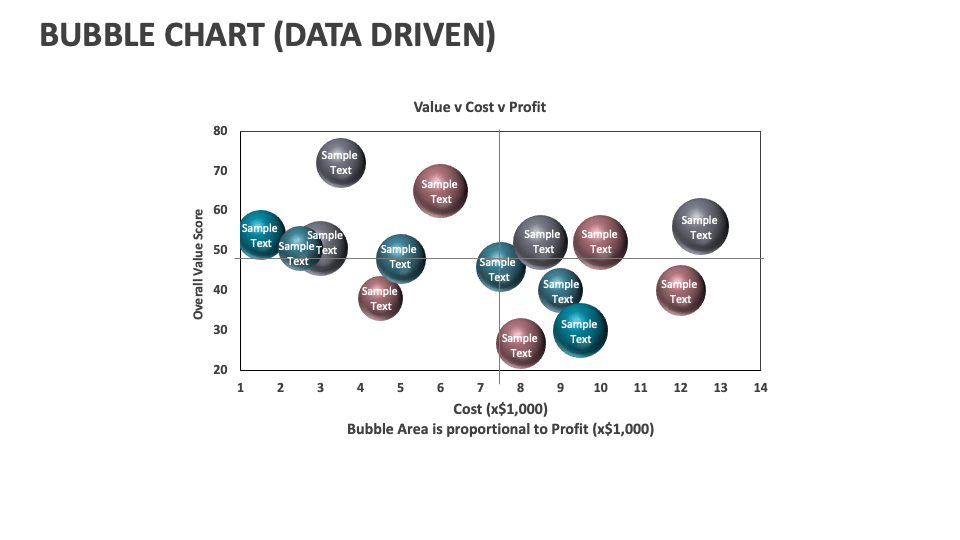
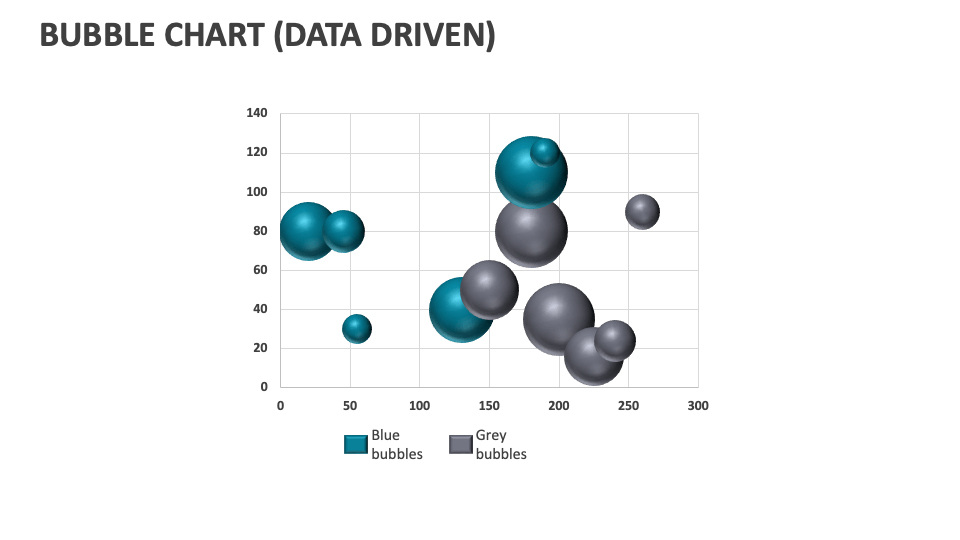
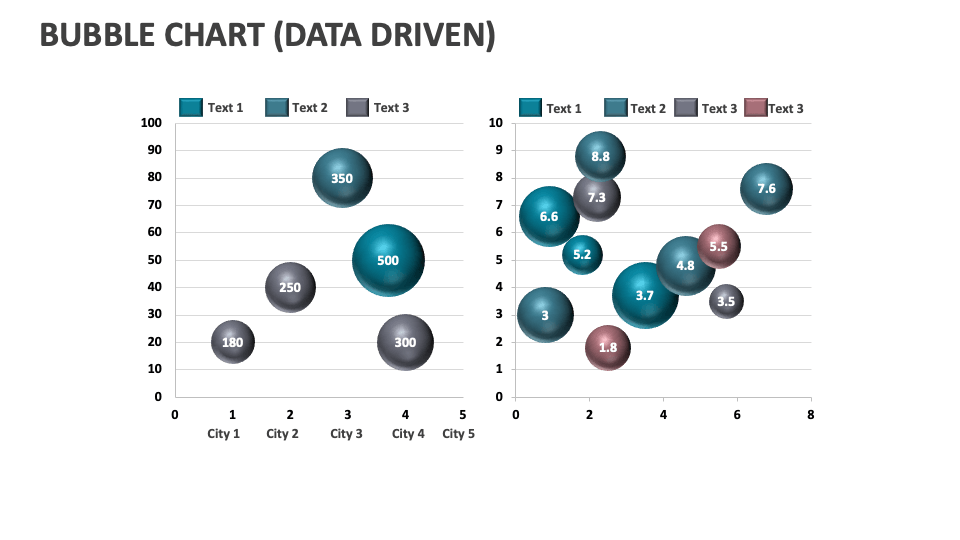
Featuring bubbles of different sizes placed at different positions, our Bubble Chart (Data Driven) presentation template is perfect for depicting relationships between variables. With the help of this deck, which is available for MS PowerPoint and Google Slides, you can present statistics and numerical data in a simplified manner.
Business leaders and financial heads can visualize their companies' revenues, profits, and market capitalization. Sales heads can capitalize on this deck to illustrate the sales performance by region or product. Marketing managers can demonstrate customer segments based on demographics, purchasing behavior, etc., with bubble size representing segment size. Team leaders can showcase employee performance based on productivity, efficiency, and engagement. Fully customizable slides!