
CAGR Icons
In stock
$5.00
item details (1 Editable Slide)
- Applications Supported: PowerPoint, Google Slides
- File Type: .pptx, Google Slides
- Aspect Ratio:16:9 (Wide Screen)
- Animation: No
CAGR Icons
CAGR Icons
(1 Editable Slide)
Related Products
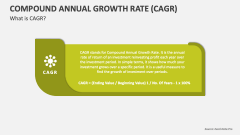
Download our CAGR Icons for MS PowerPoint and Google Slides presentations to explain concepts and information related to the compound annual growth rate in a visually appealing manner. The slide is loaded with bold and line icons of a calendar, a knight, a bar graph with an arrow moving in an upward direction, etc.
Financial advisors and investment planners can use these icons in their presentations to visually communicate how the CAGR helps calculate and estimate the past and future returns of a specific investment plan. By using these icons in your slides, you can draw the audience’s attention to the pros and cons of CAGR and how to compare the performance of different investments. Business leaders can use the icons to showcase the role of CAGR in helping businesses forecast their business's growth and evaluate the success of their strategies over time.