
Circle Split Diagram
In stock
$5.00
item details (11 Editable Slides)
- Applications Supported: PowerPoint, Google Slides
- File Type: .pptx, Google Slides
- Aspect Ratio:16:9 (Wide Screen)
- Animation: Yes
Circle Split Diagram
Circle Split Diagram
(11 Editable Slides)

Related Products
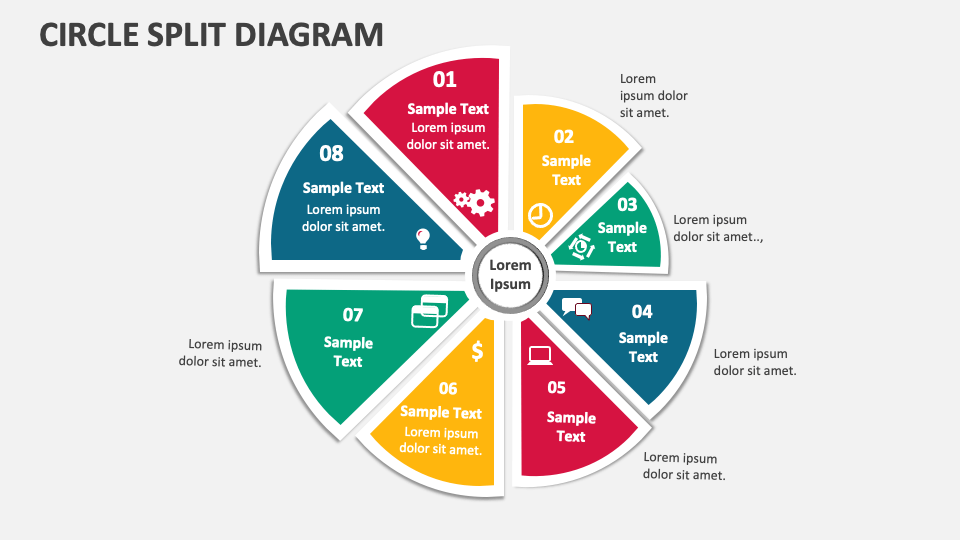
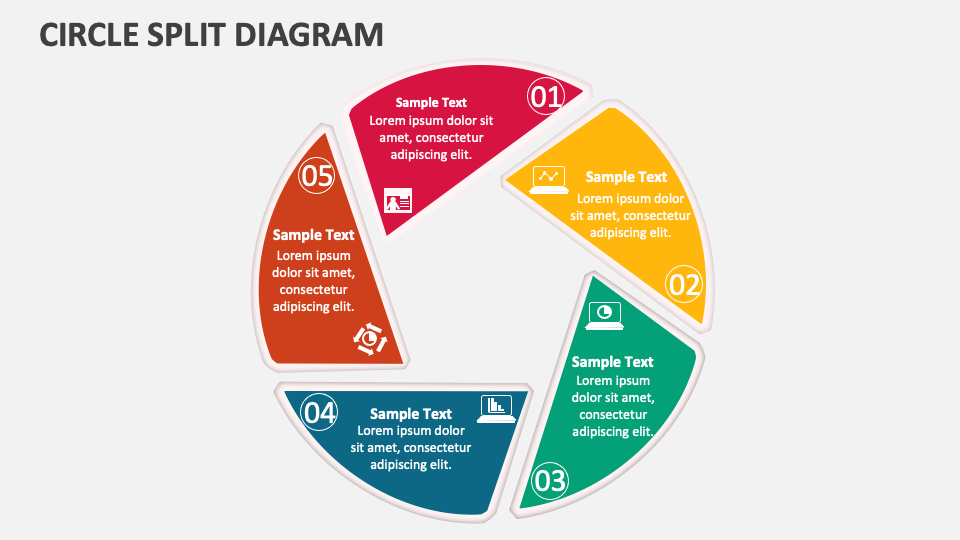
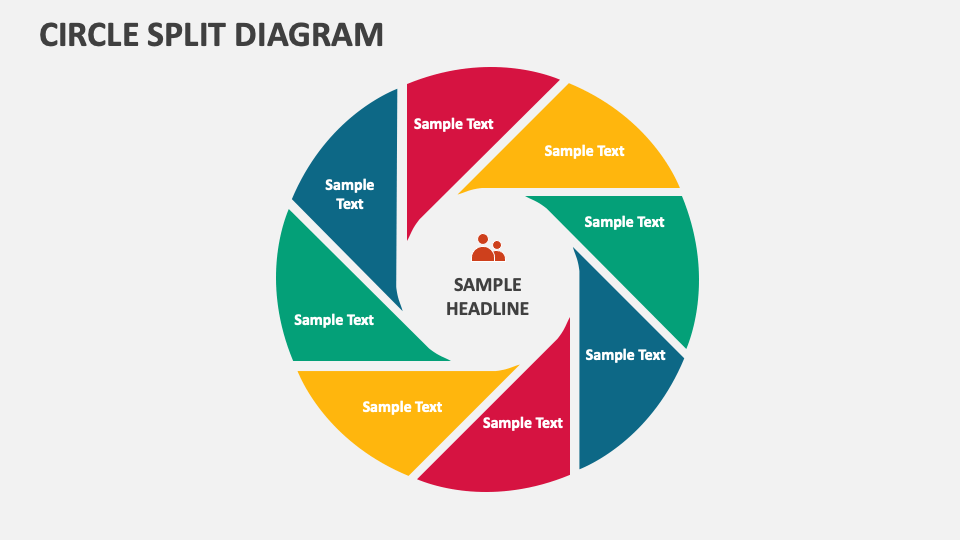
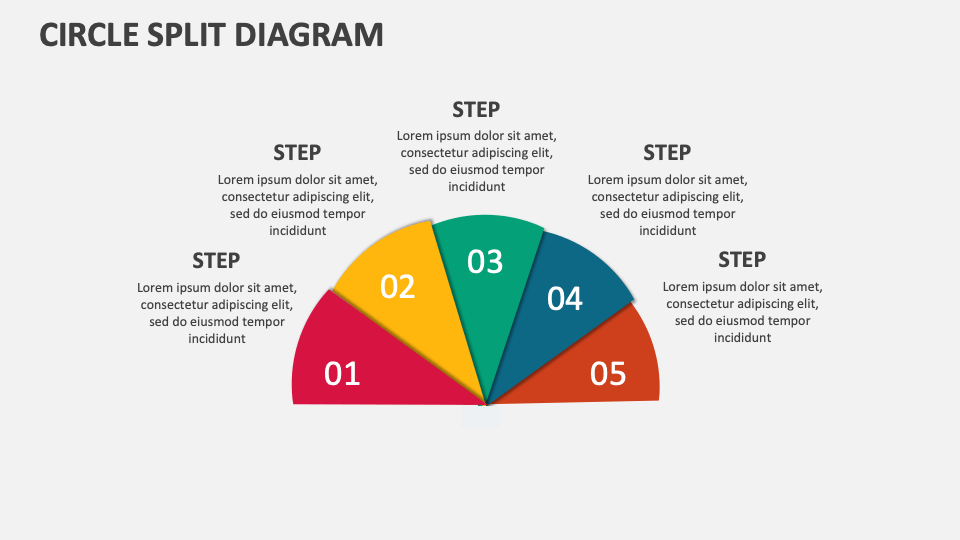
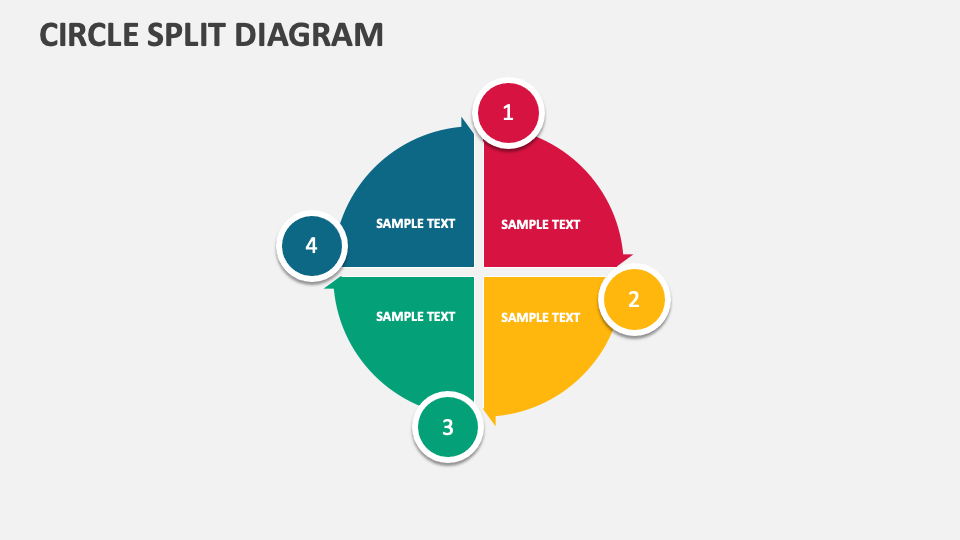
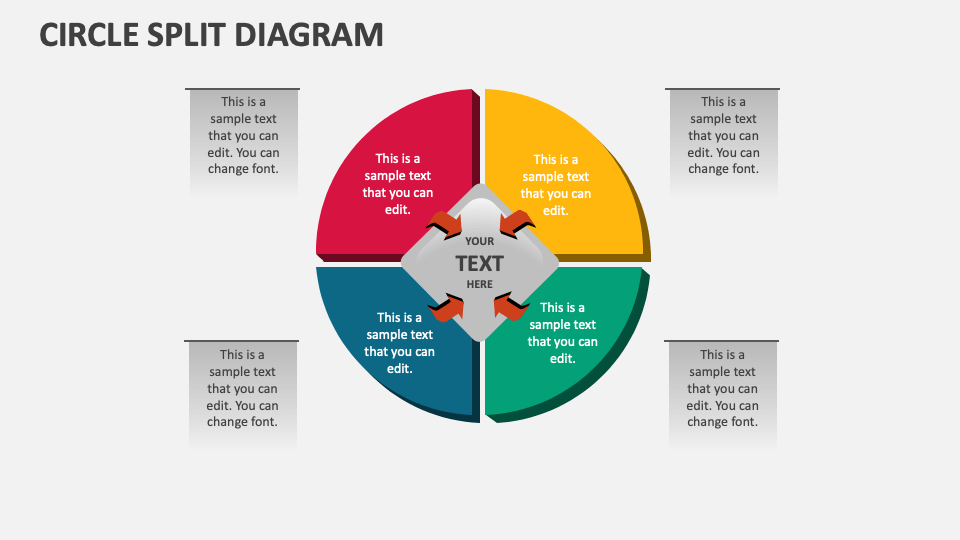
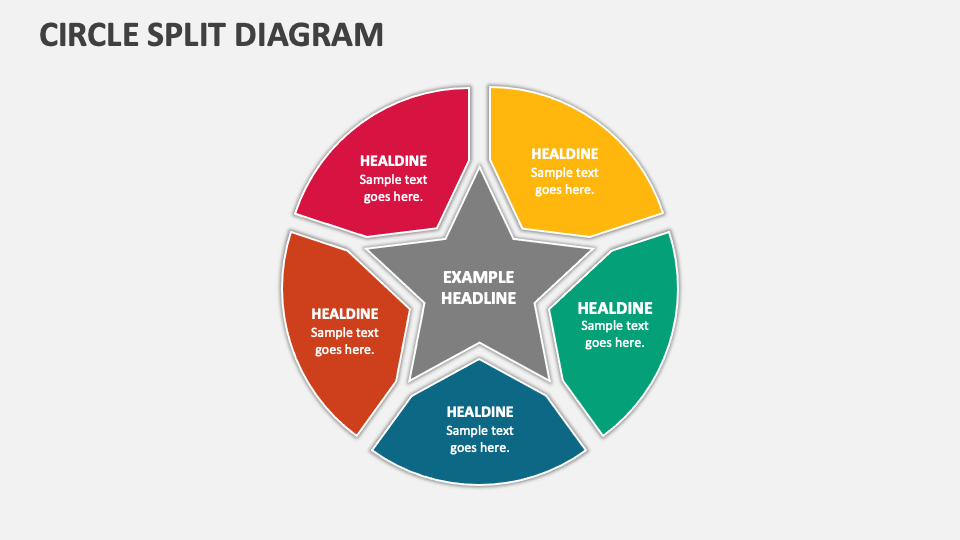
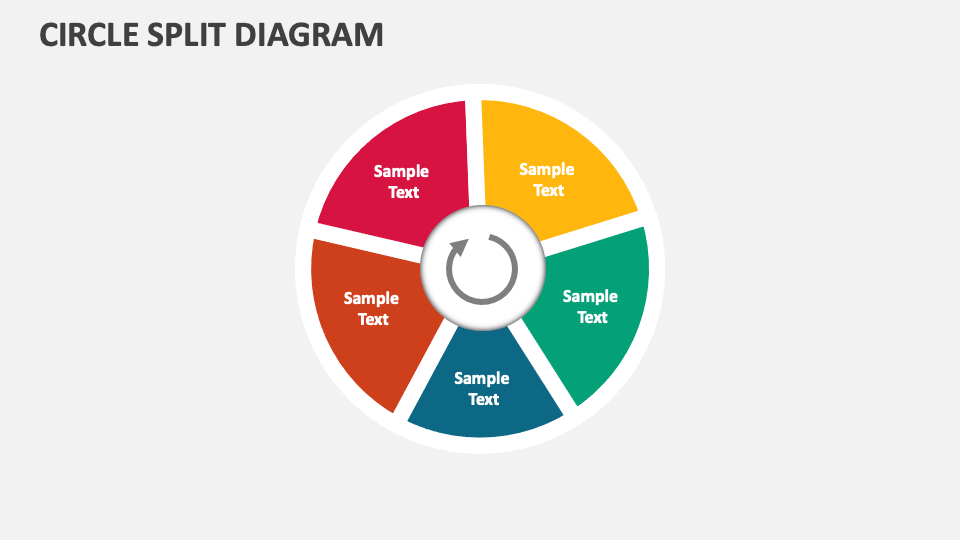
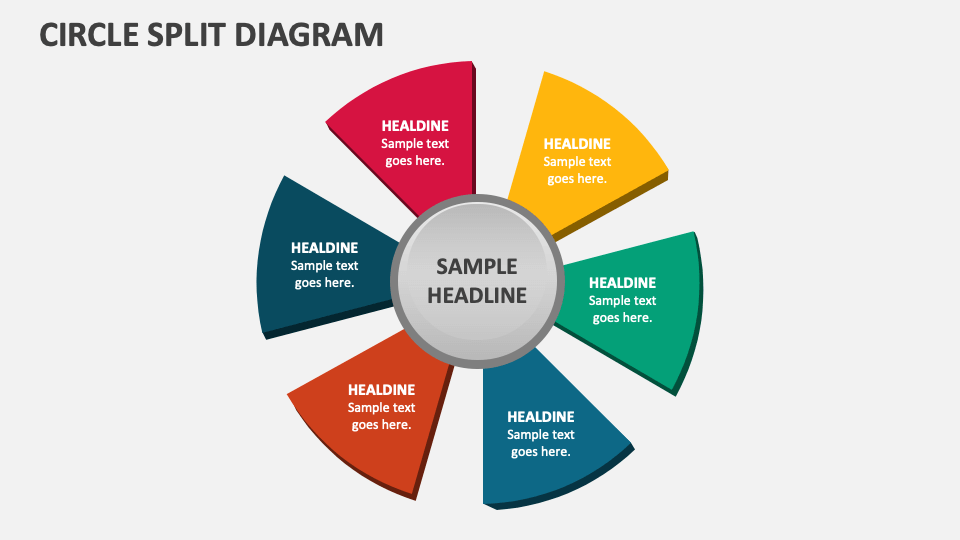
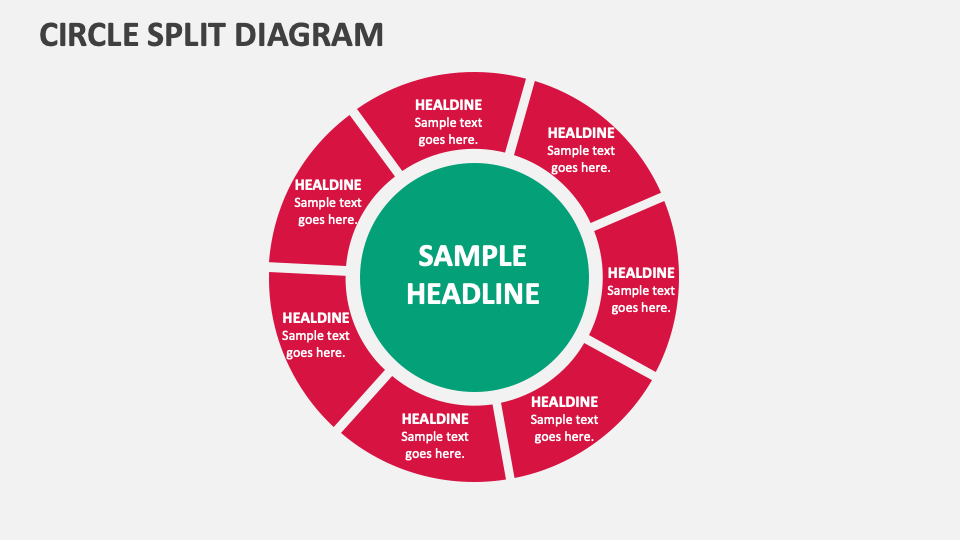
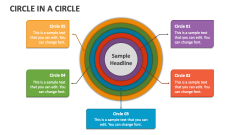
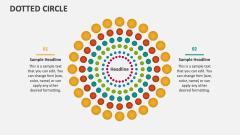
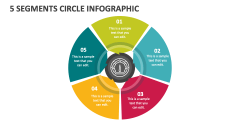
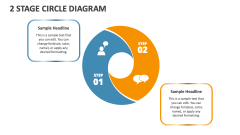
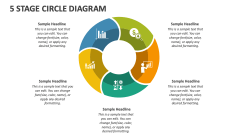
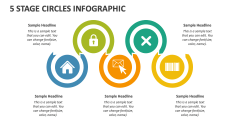
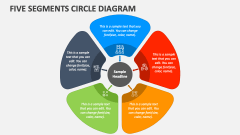
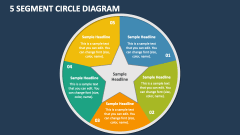
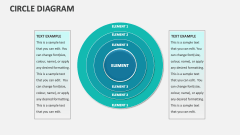
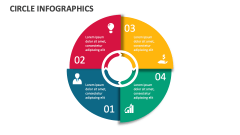
If you wish to present concepts about interconnected elements, distribution, comparisons, or layered information, we have got you covered! Download our Circle Split Diagram for MS PowerPoint and Google Slides to visually stimulate the audience with your presentation.
Sales heads and marketing managers can capitalize on this template to showcase different market segments or demographic distributions. Business owners can shed light on the various sources of revenue in their company and the distribution of a budget across different departments or categories. Product heads can depict the composition of product features or components, multiple versions or configurations of a product, etc.