
Cuba Map
In stock
$5.00
item details (10 Editable Slides)
- Applications Supported: PowerPoint, Google Slides
- File Type: .pptx, Google Slides
- Aspect Ratio:16:9 (Wide Screen)
- Animation: No
Cuba Map
Cuba Map
(10 Editable Slides)
Related Products
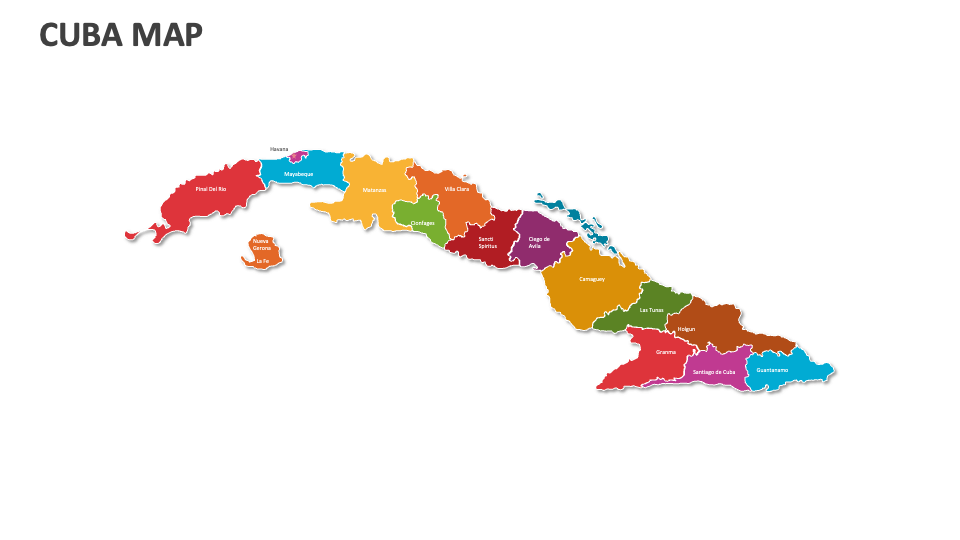
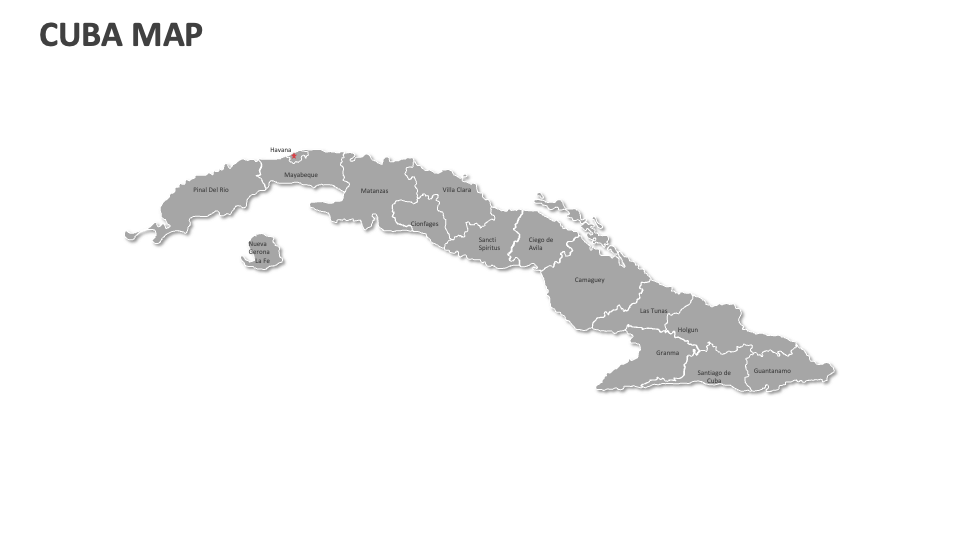
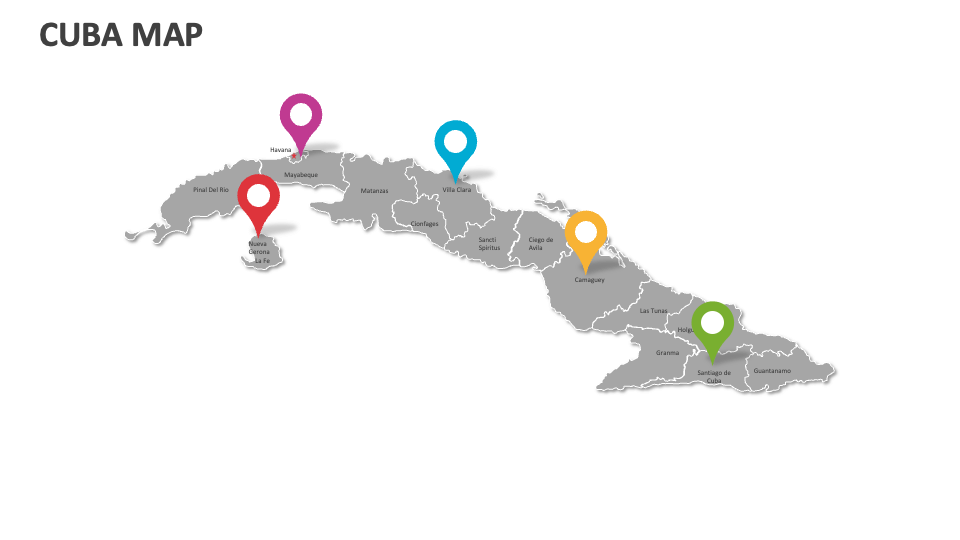
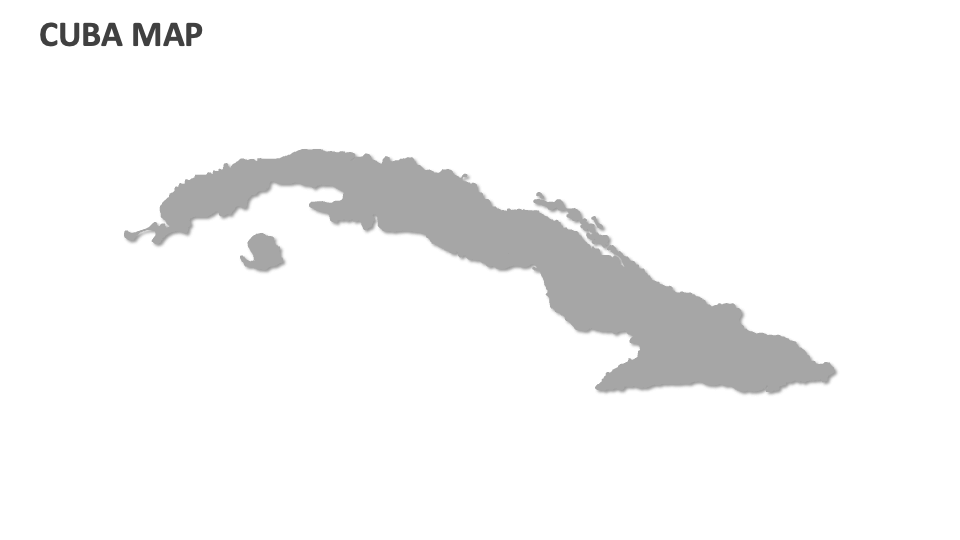
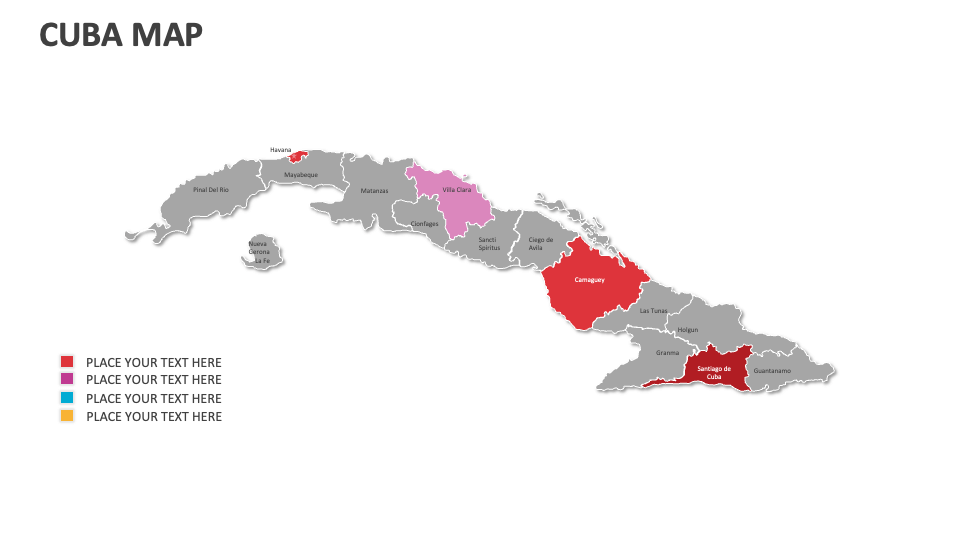
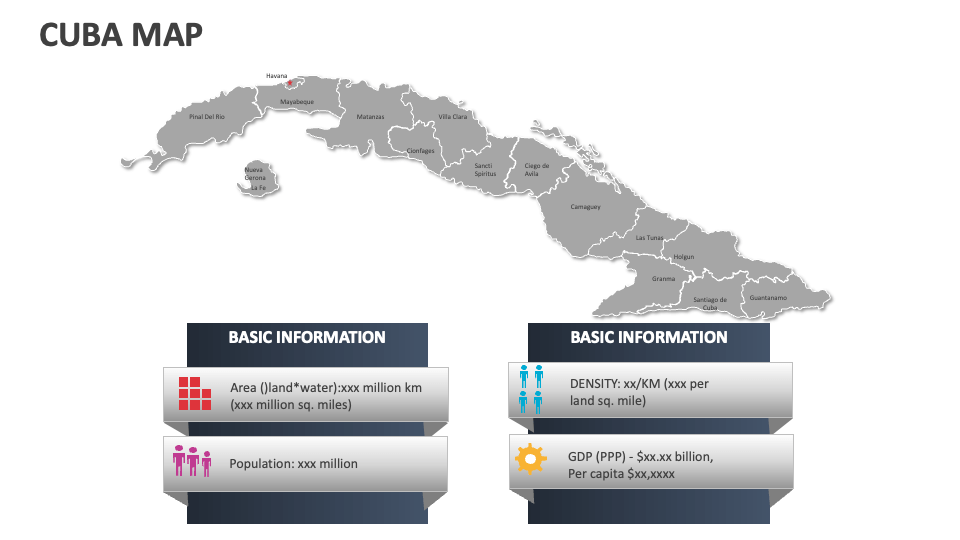
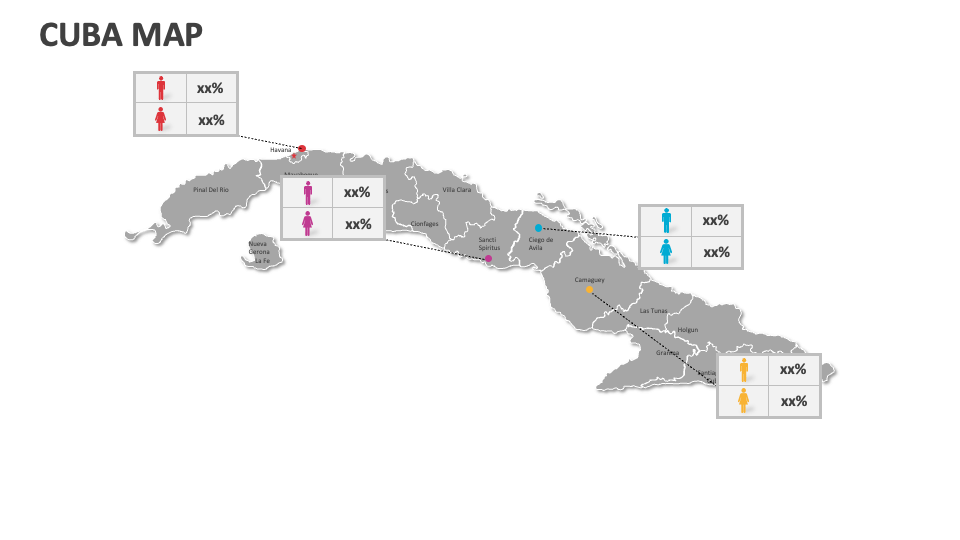
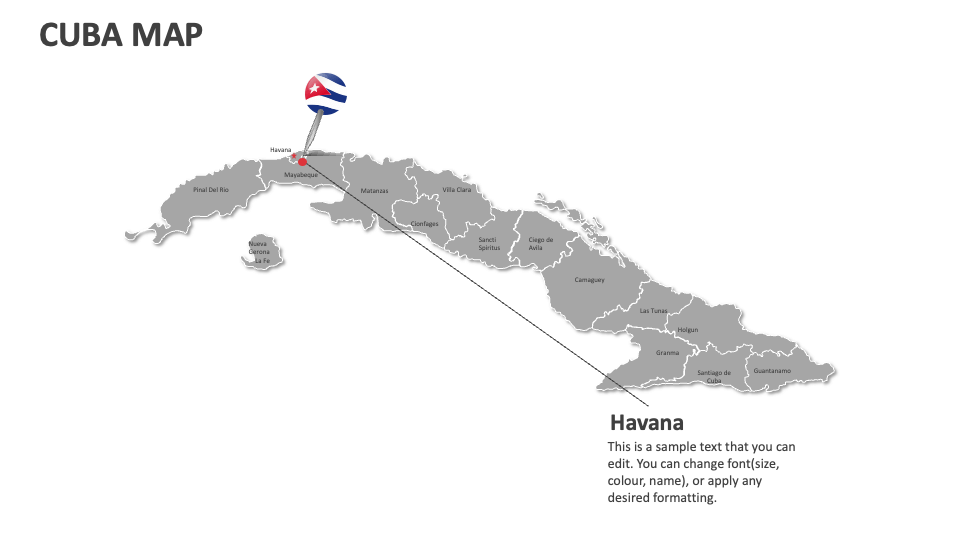
We have come up with the Cuba Map MS PowerPoint and Google Slides presentation template to help presenters from diverse backgrounds showcase the highest and least populated regions, agricultural zones and crop distribution, health statistics and census data, etc., in Cuba. Download these 100% editable slides now!
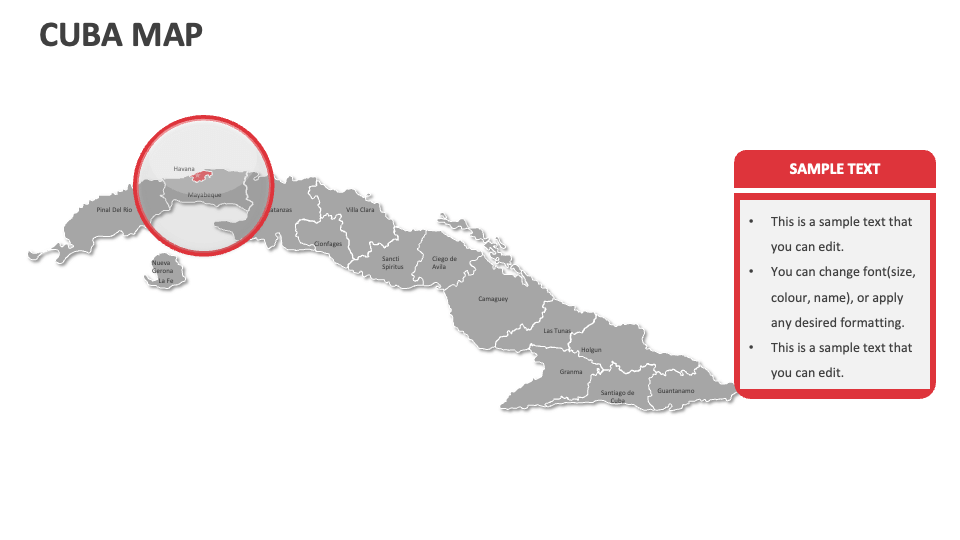
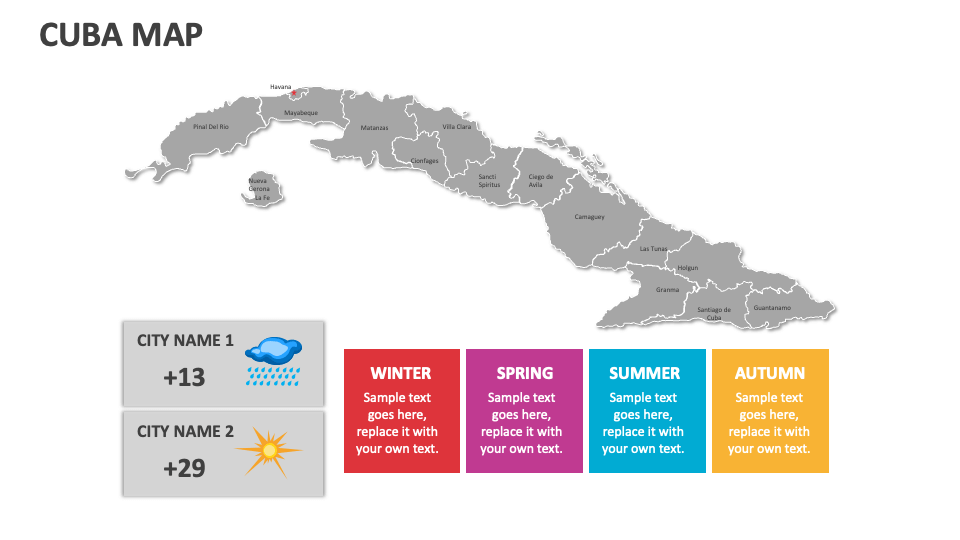
Business leaders can use this deck to highlight the ideal regions in Cuba for expanding their business operations, as well as the legal requirements and compliance regulations for conducting business in these areas. Scientists can incorporate these map illustrations into their presentations to present information on Cuba’s biodiversity hotspots, ecological research sites, conservation efforts, and more. Meteorologists can visualize information about the weather and temperature of various Cuban cities.