
Diamond Chart
In stock
$5.00
item details (5 Editable Slides)
- Applications Supported: PowerPoint, Google Slides
- File Type: .pptx, Google Slides
- Aspect Ratio:16:9 (Wide Screen)
- Animation: Yes
Diamond Chart
Diamond Chart
(5 Editable Slides)

Related Products
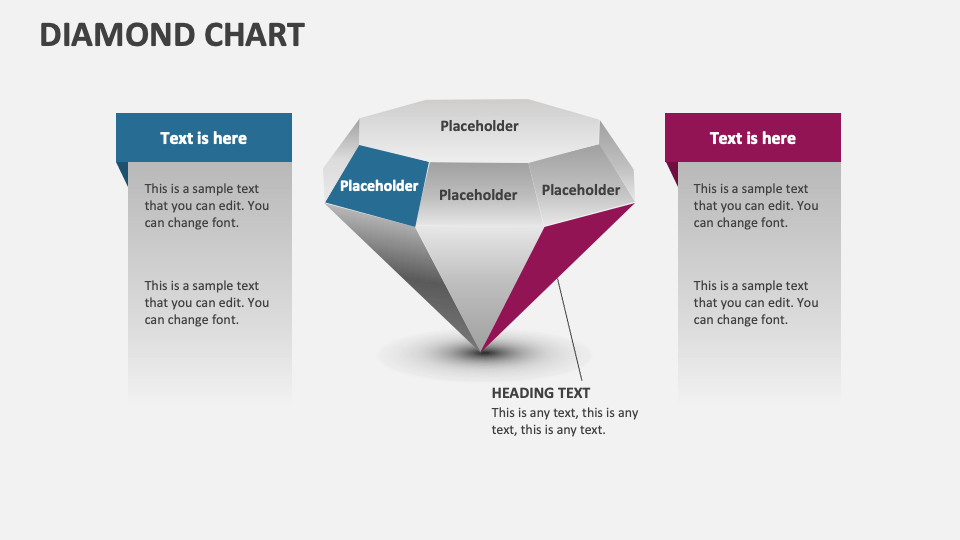
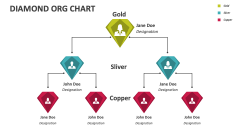
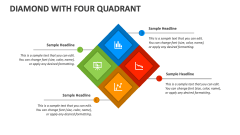
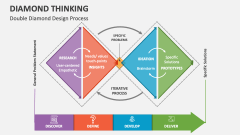
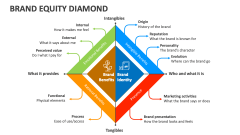
Use our Diamond Chart presentation template for MS PowerPoint and Google Slides to visualize ideas surrounding a central concept, essential elements of a plan, and much more. The deck features high-definition visuals that can be used without worrying about pixelation concerns.
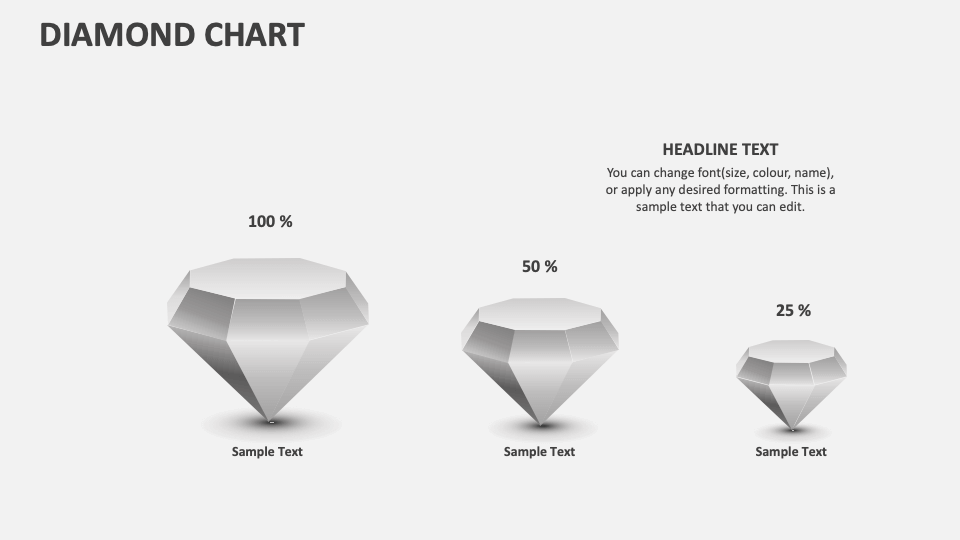
Project heads can capitalize on this set to showcase the completion rate or status of various projects. Sales heads and product managers can illustrate the focus points of a sales plan, core USPs of a product, building blocks of a product promotion strategy, etc. Marketing professionals can depict the marketing plans aligned with the organization’s vision and goals. IT heads can visualize the potential risks and their impact, key performance indicators of an IT strategy, and more.