
Horizontal Pipeline Infographics
In stock
$5.00
item details (6 Editable Slides)
- Applications Supported: PowerPoint, Google Slides
- File Type: .pptx, Google Slides
- Aspect Ratio:16:9 (Wide Screen)
- Animation: Yes
Horizontal Pipeline Infographics
Horizontal Pipeline Infographics
(6 Editable Slides)
Related Products

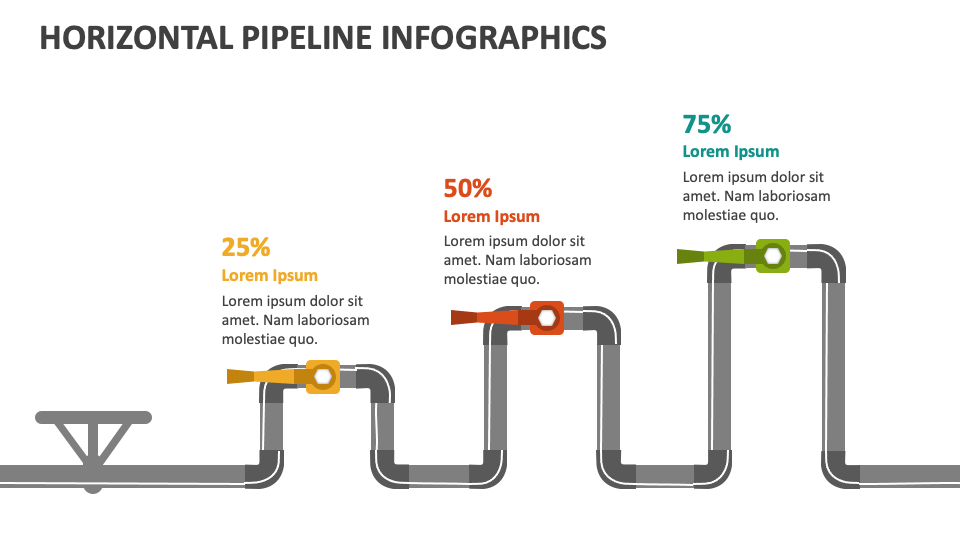
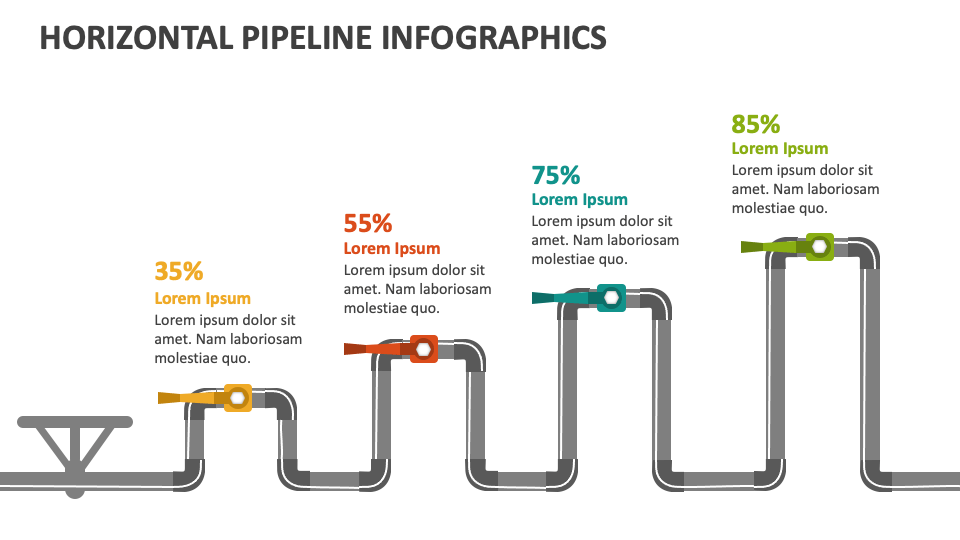
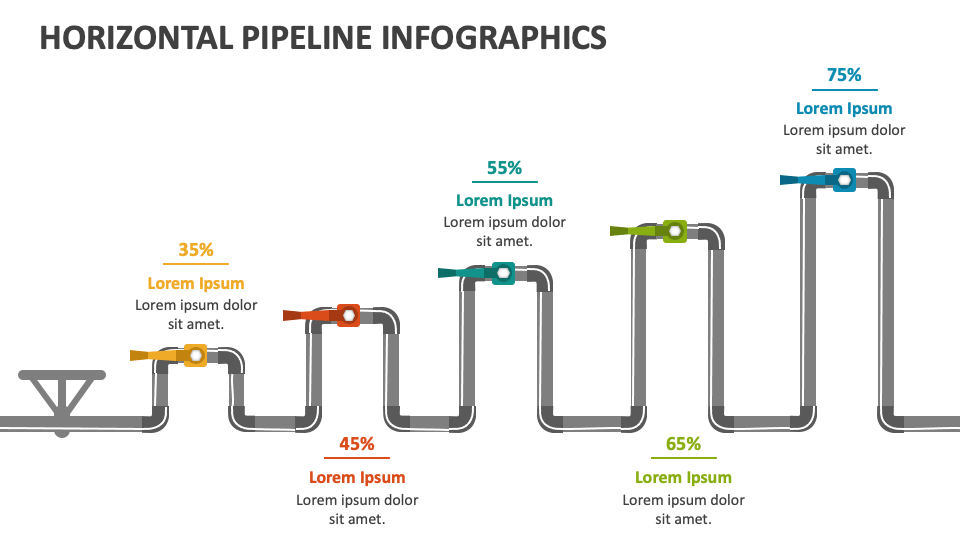
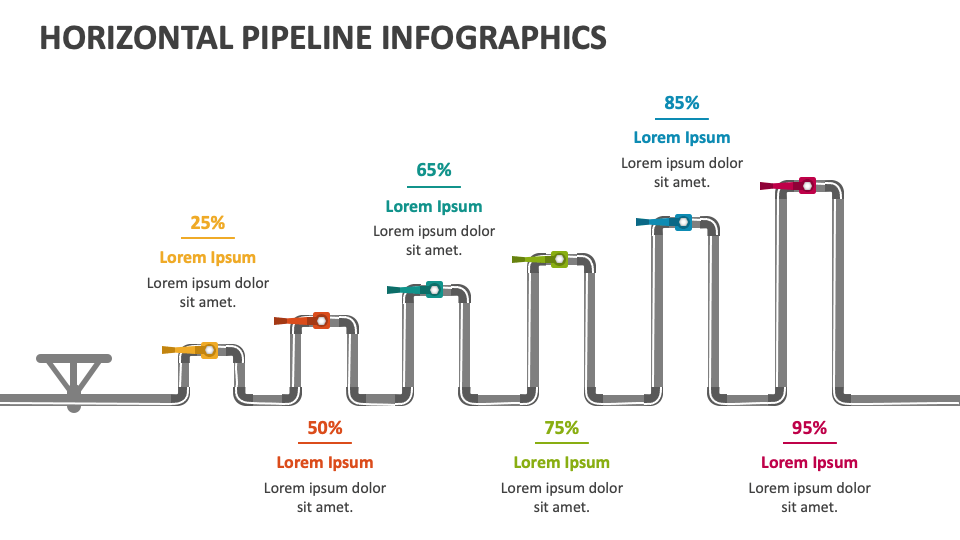
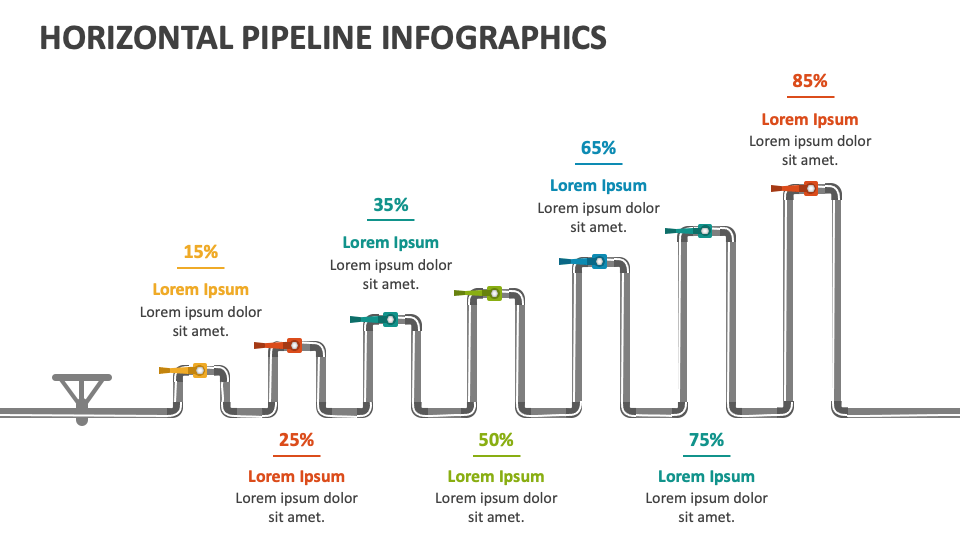
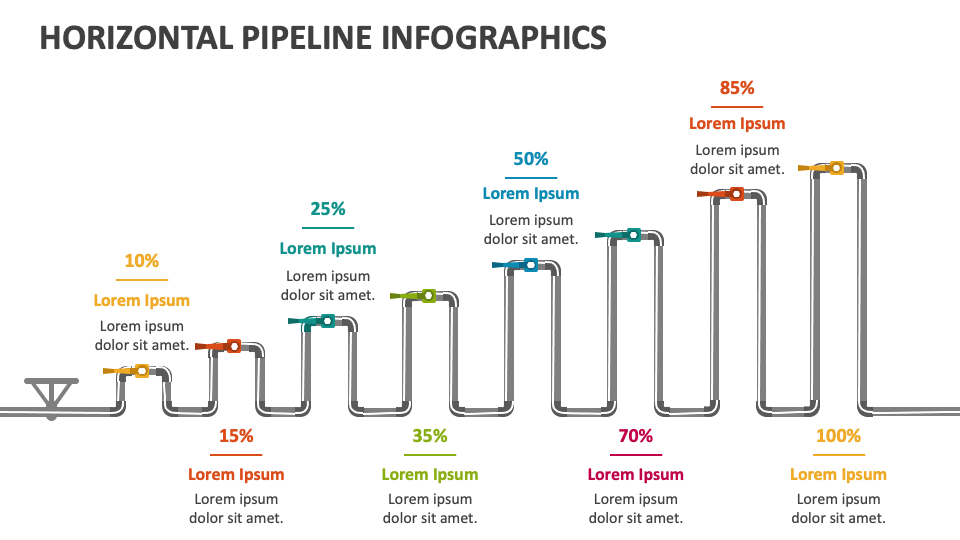
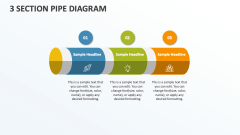
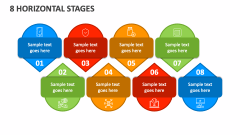
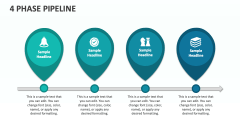
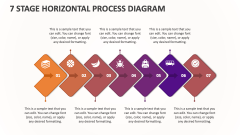
Download our Horizontal Pipeline Infographics for MS PowerPoint and Google Slides to visualize the stages of a process along with their completion percentages. You can also demonstrate topics related to progress, goal attainment, and success rates across different fields.
Project heads can use this versatile template to shed light on the status of ongoing projects. Database managers, data scientists, and data analysts can showcase the various stages data goes through during its processing. HR heads can depict the classifications of prospects within a talent pipeline and the strategies for effectively nurturing and advancing talent through the pipeline.