
Kentucky Map
In stock
$5.00
item details (8 Editable Slides)
- Applications Supported: PowerPoint, Google Slides
- File Type: .pptx, Google Slides
- Aspect Ratio:16:9 (Wide Screen)
- Animation: No
Kentucky Map
Kentucky Map
(8 Editable Slides)

Related Products


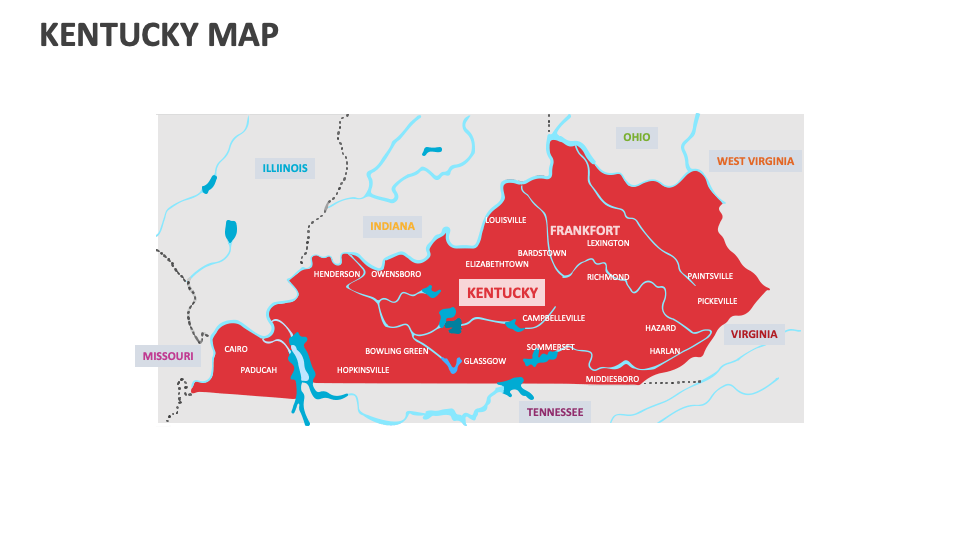
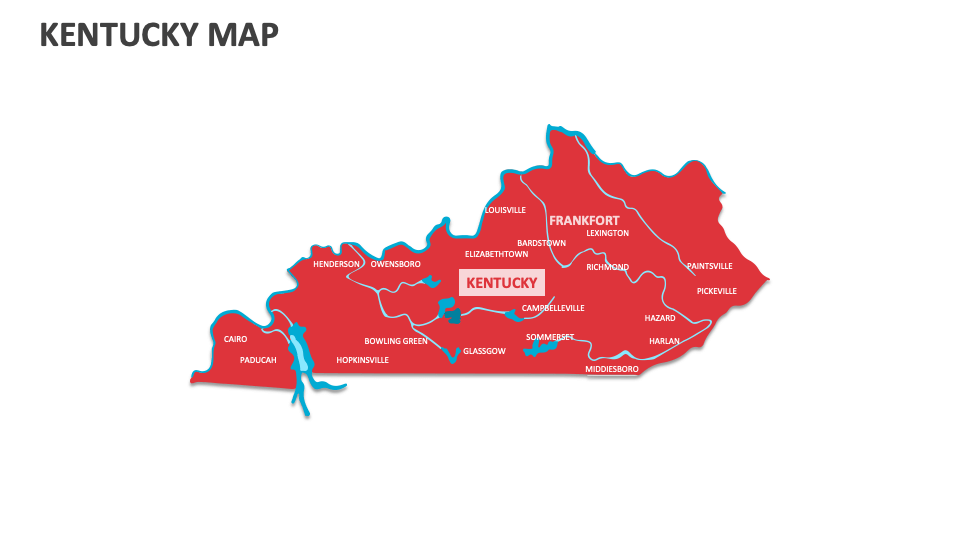
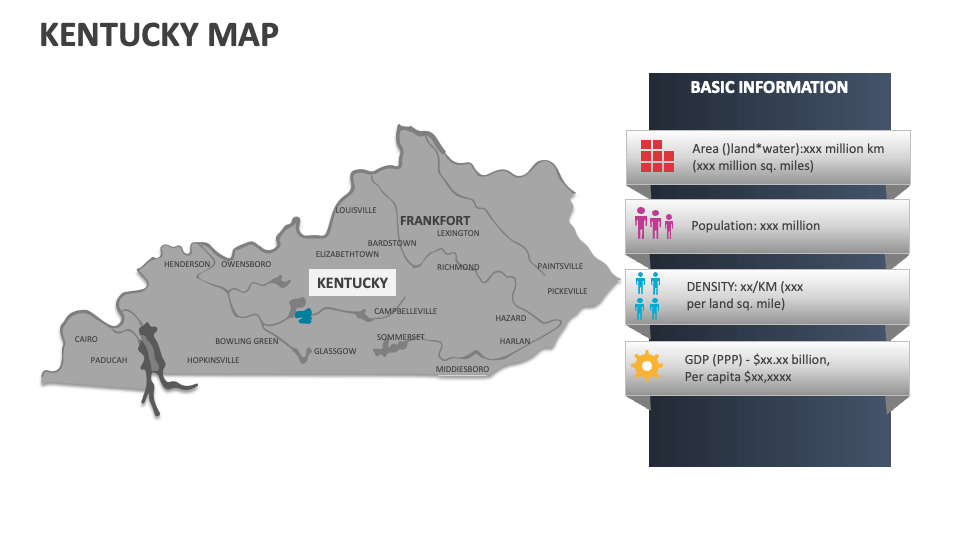
We have come up with the Kentucky Map MS PowerPoint and Google Slides presentation template to help you illustrate Kentucky’s major cities, key economic zones and industries, urban development patterns, transportation routes and hubs, investment opportunities by region, and more.
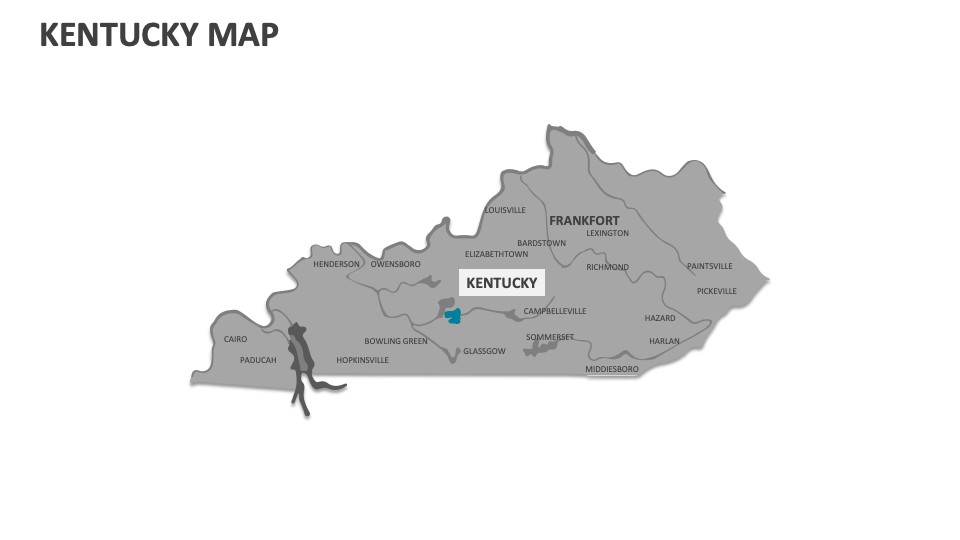
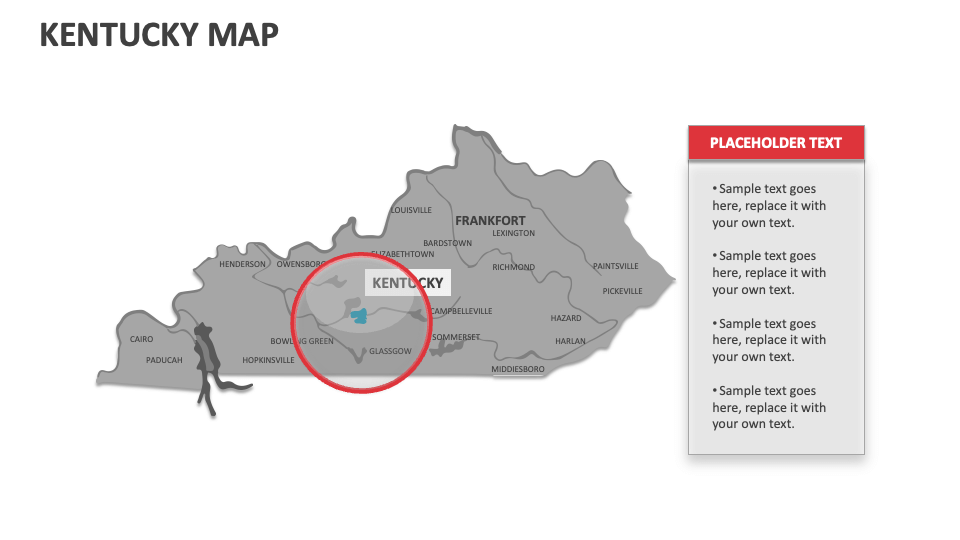
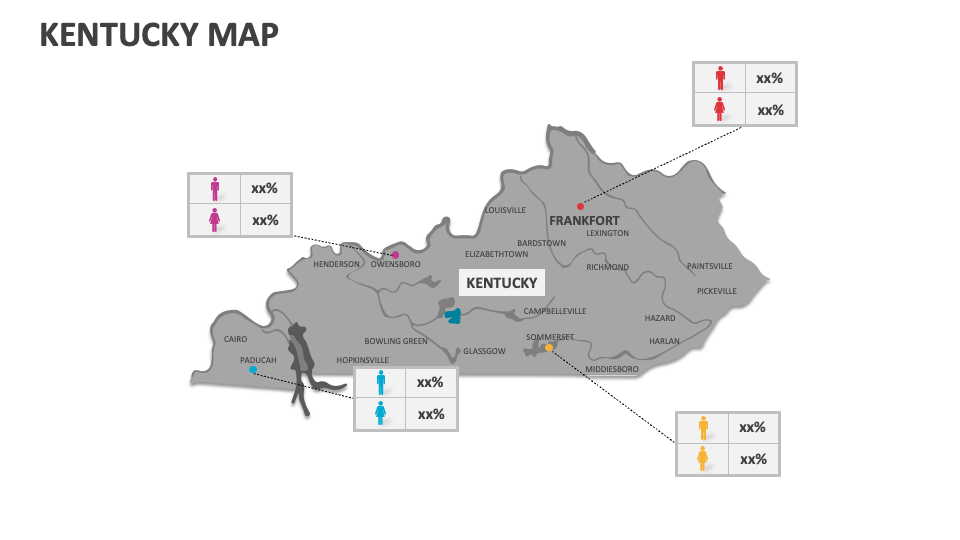
Market analysts can utilize this deck to showcase the customer demand patterns, market trends, and distribution of key industries across Kentucky. Business consultants can shed light on the locations of the major retail centers, shopping districts, and commercial hubs in this U.S. state. Real estate agents can visualize information about current real estate trends, housing market locations, and commercial/residential property values in specific areas.