
Laffer Curve
In stock
$5.00
item details (9 Editable Slides)
- Applications Supported: PowerPoint, Google Slides
- File Type: .pptx, Google Slides
- Aspect Ratio:16:9 (Wide Screen)
- Animation: Yes
Laffer Curve
Laffer Curve
(9 Editable Slides)


Related Products


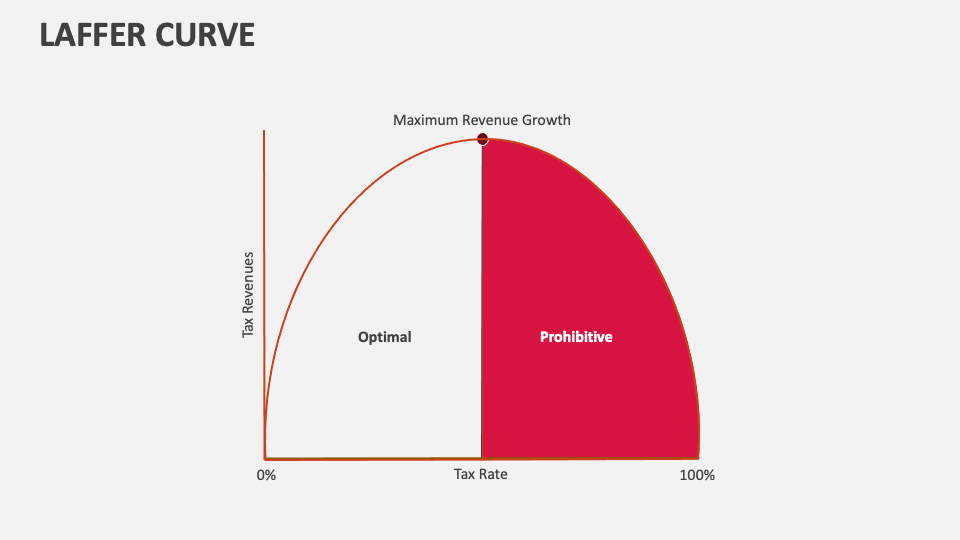
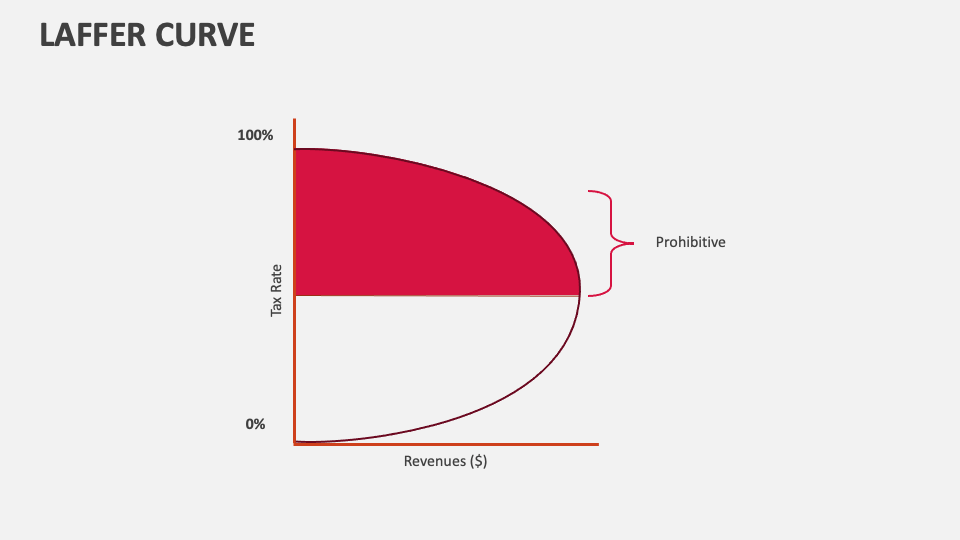
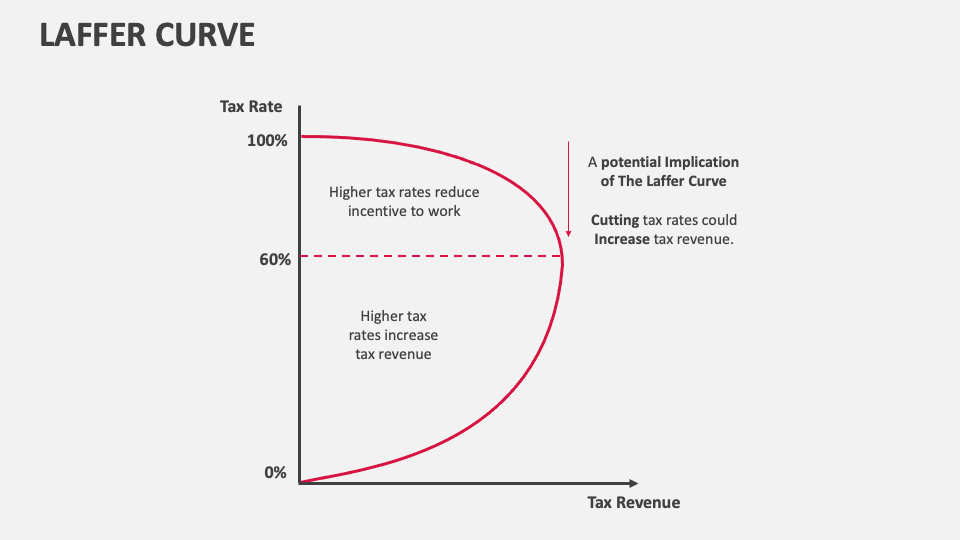
Leverage our Laffer Curve presentation template, exclusively designed for MS PowerPoint and Google Slides, to showcase the theoretical relationship between tax rates and government revenue in an easy-to-understand manner. 100% editable slides!
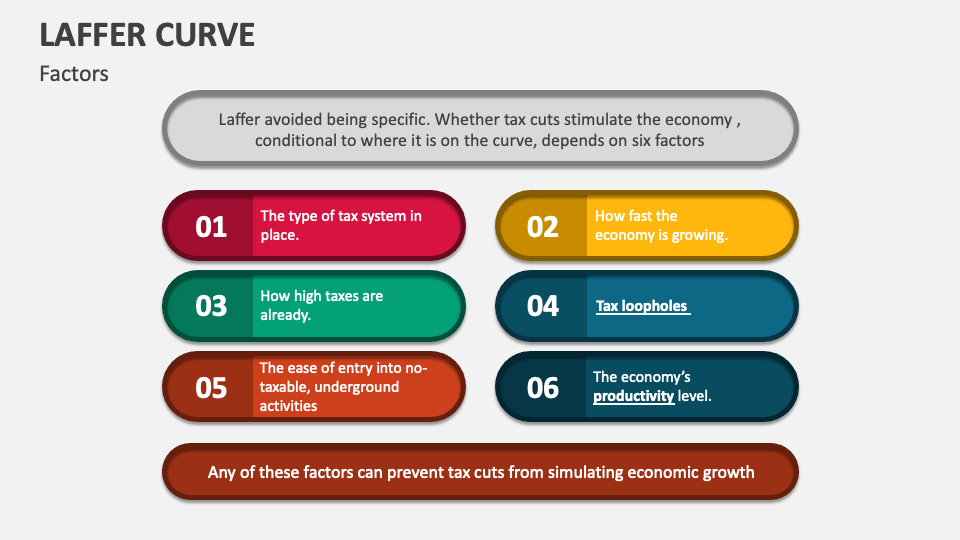
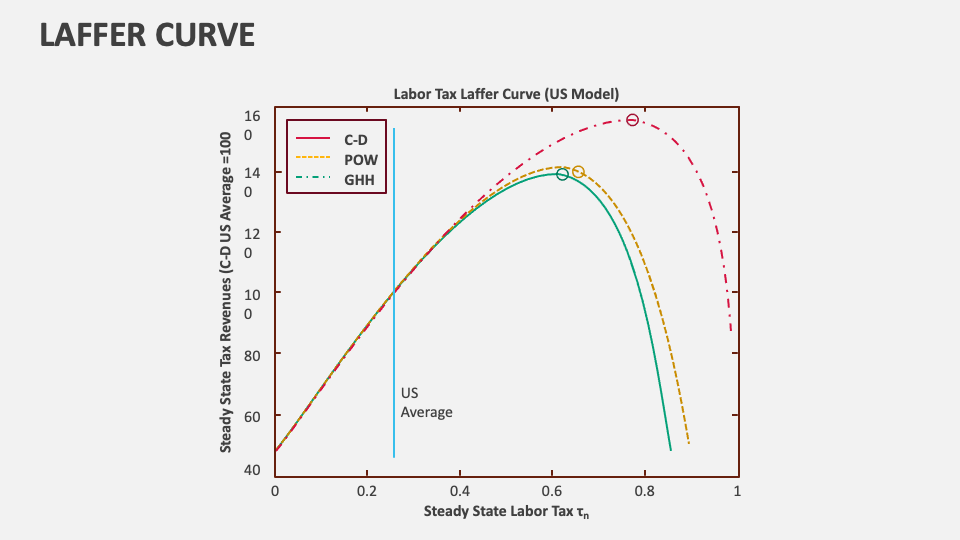
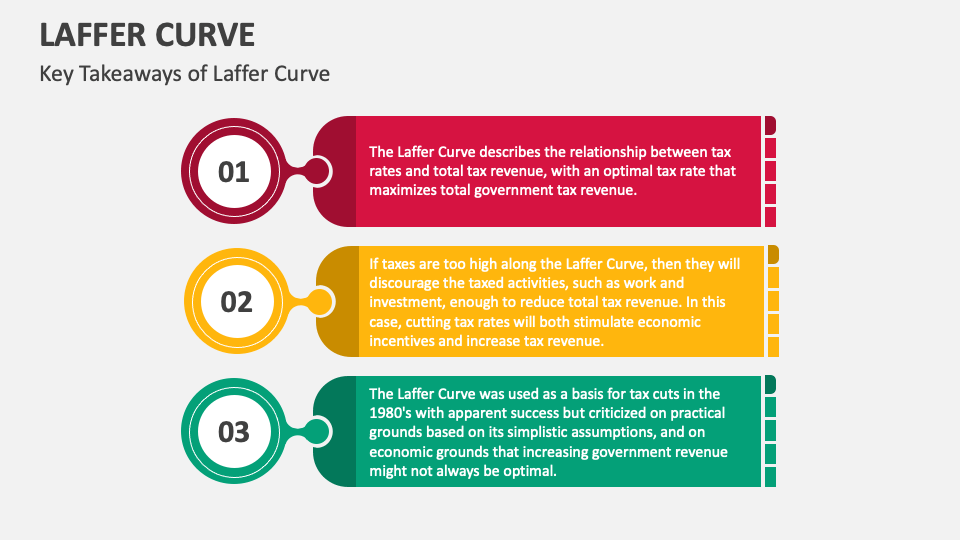
Educators and government officials can explain how this curve posits that there is an optimal tax rate where revenue is maximized, beyond which higher taxes lead to reduced economic activity and lower revenue. You can use this set to illustrate the factors that prevent tax cuts from stimulating economic growth. You can further depict how this curve emphasizes the importance of finding the optimal tax rate to maximize revenue without hindering economic productivity.