
J Curve
In stock
$5.00
item details (7 Editable Slides)
- Applications Supported: PowerPoint, Google Slides
- File Type: .pptx, Google Slides
- Aspect Ratio:16:9 (Wide Screen)
- Animation: Yes
J Curve
J Curve
(7 Editable Slides)
Related Products

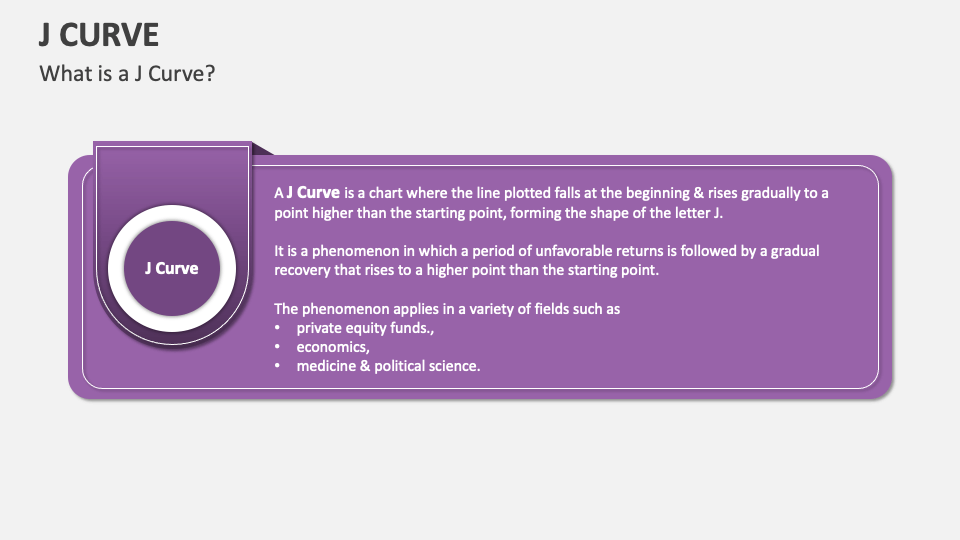
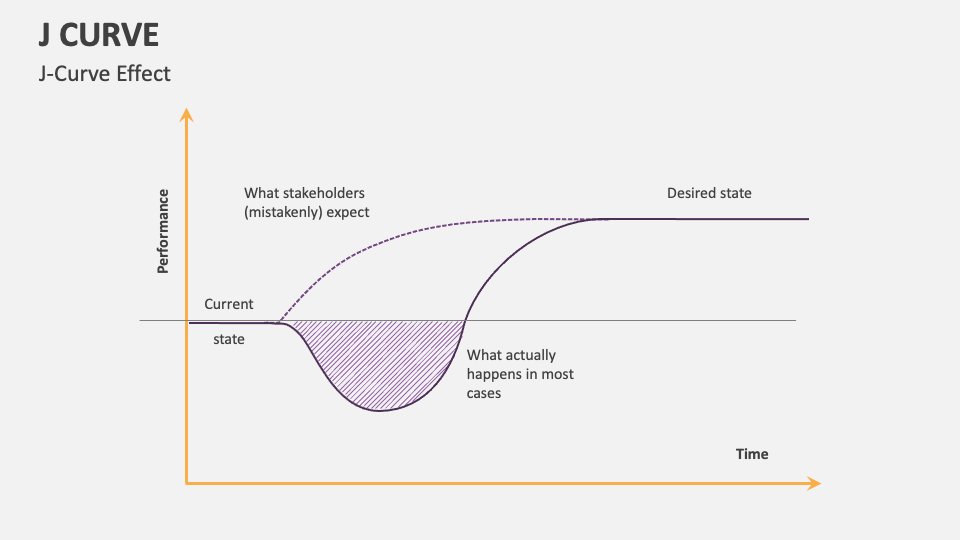
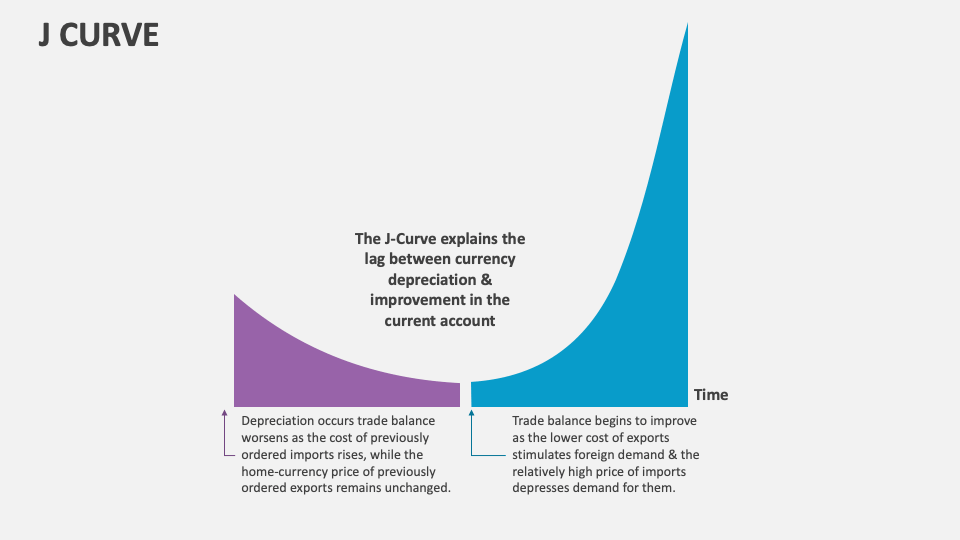
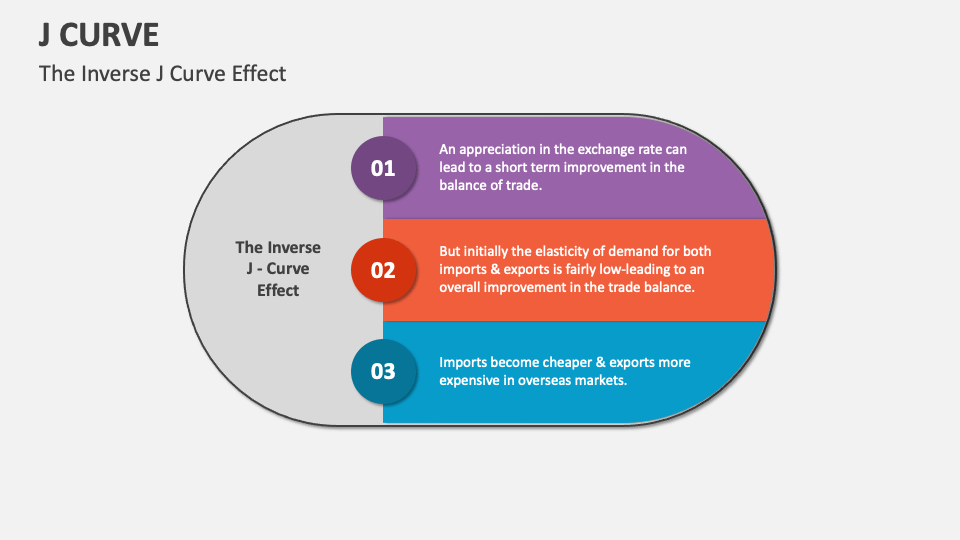
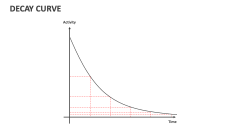
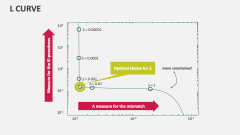
Leverage our J Curve MS PowerPoint and Google Slides presentation template to depict the graphical representation of the initial increase in costs followed by a later period of positive returns or benefits. The eye-catching illustrations of this deck will help you mesmerize the audience.
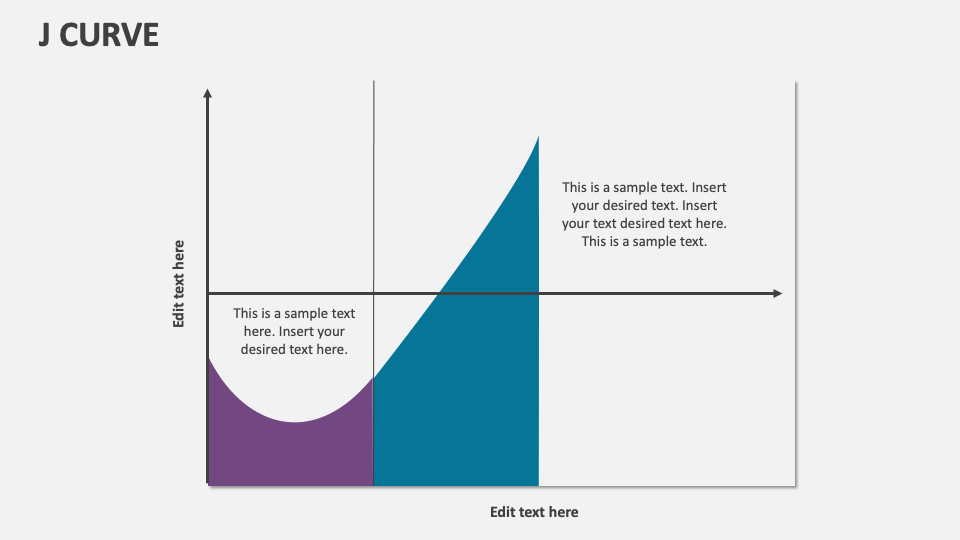
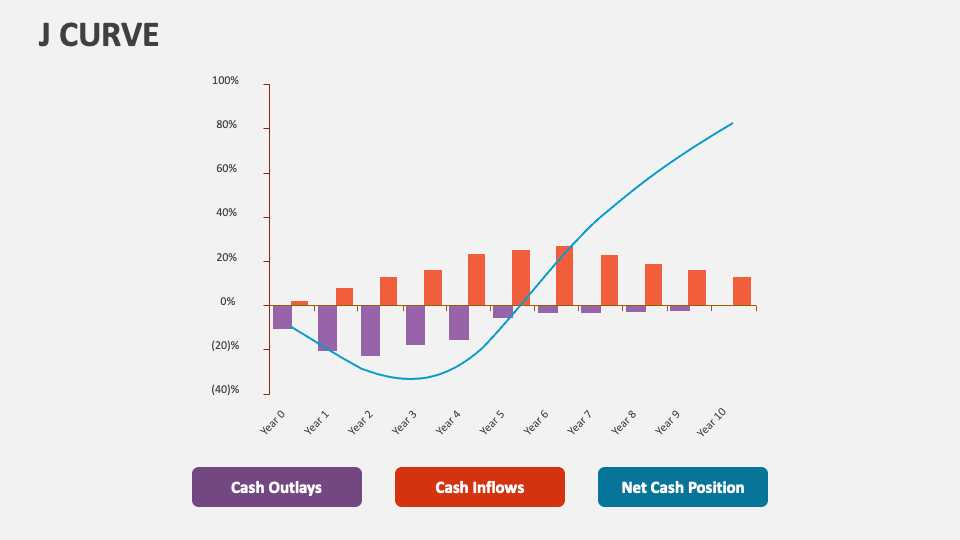
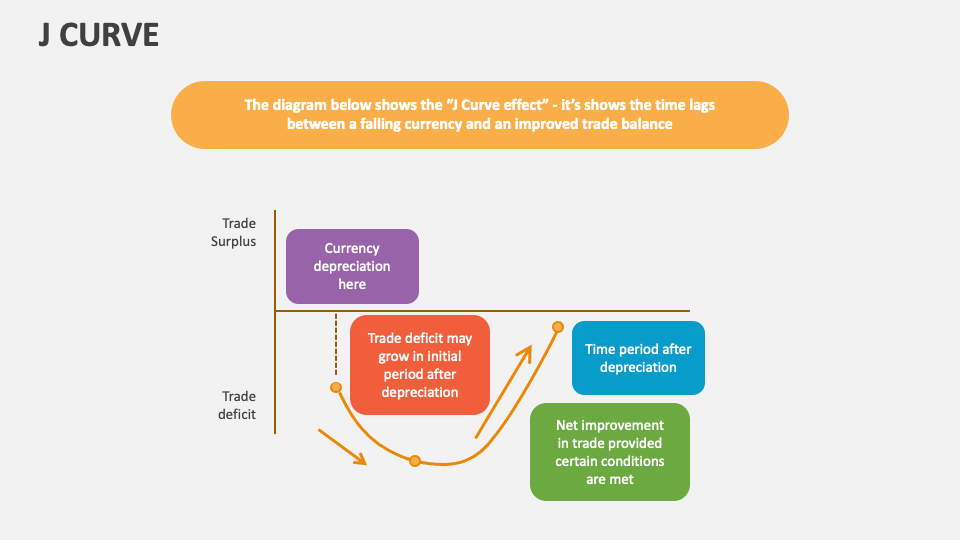
This set is perfect for economists, lead strategists, mathematicians, researchers, and finance experts to explain this phenomenon to their audience in a visually impressive manner. Market analysts can depict the initial investment and challenges when entering new markets, followed by profitable growth. Use this deck to illustrate topics about performance change over time, currency/trade depreciation, initial investment and development costs before a product reaches a profitable stage in its life cycle, and more.