
Munich Map
In stock
$5.00
item details (2 Editable Slides)
- Applications Supported: PowerPoint, Google Slides
- File Type: .pptx, Google Slides
- Aspect Ratio:16:9 (Wide Screen)
- Animation: No
Munich Map
Munich Map
(2 Editable Slides)
Related Products
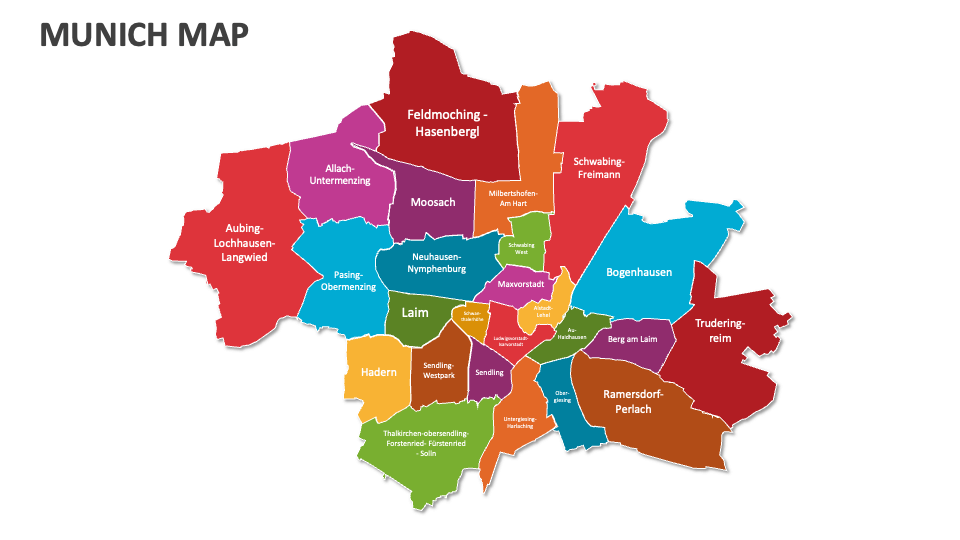
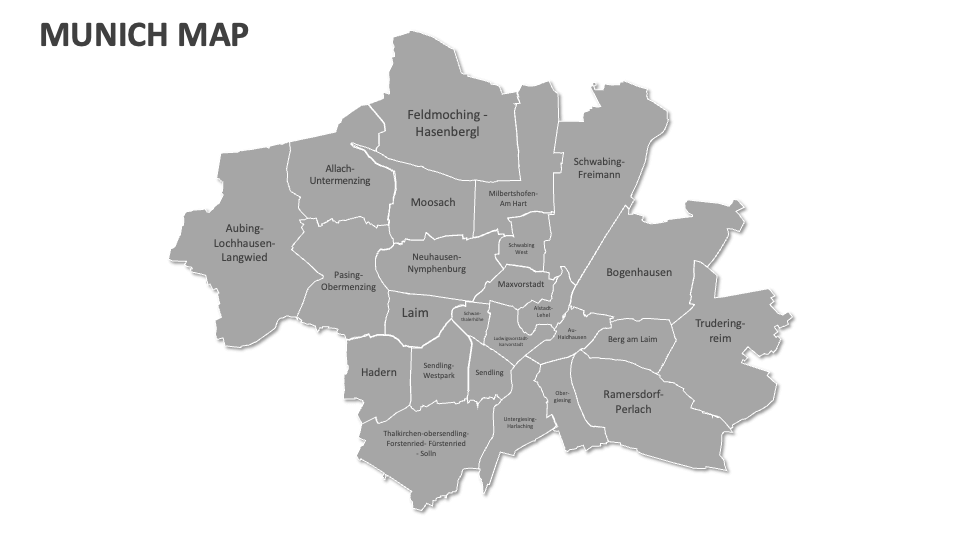
Our Munich Map MS PowerPoint and Google Slides presentation template will help you showcase information about Munich’s census data, human migration patterns, literacy rates, health and crime statistics, historical and current trade routes, agricultural zones and crop distribution, and more.
Business leaders and government officials can visualize the locations of key government offices and regulatory bodies relevant to business operations. Logistics heads and supply chain heads can shed light on the areas with logistics hubs, warehouse units, and supply chain infrastructure in this capital city. Researchers can highlight the locations of research and development facilities focused on emerging technologies. You can also illustrate information about climate conditions, average temperature, and weather patterns in various regions of Munich.