
Netherlands Map
In stock
$5.00
item details (9 Editable Slides)
- Applications Supported: PowerPoint, Google Slides
- File Type: .pptx, Google Slides
- Aspect Ratio:16:9 (Wide Screen)
- Animation: No
Netherlands Map
Netherlands Map
(9 Editable Slides)
Related Products
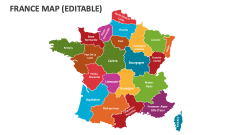
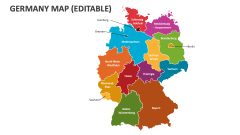
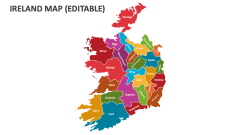
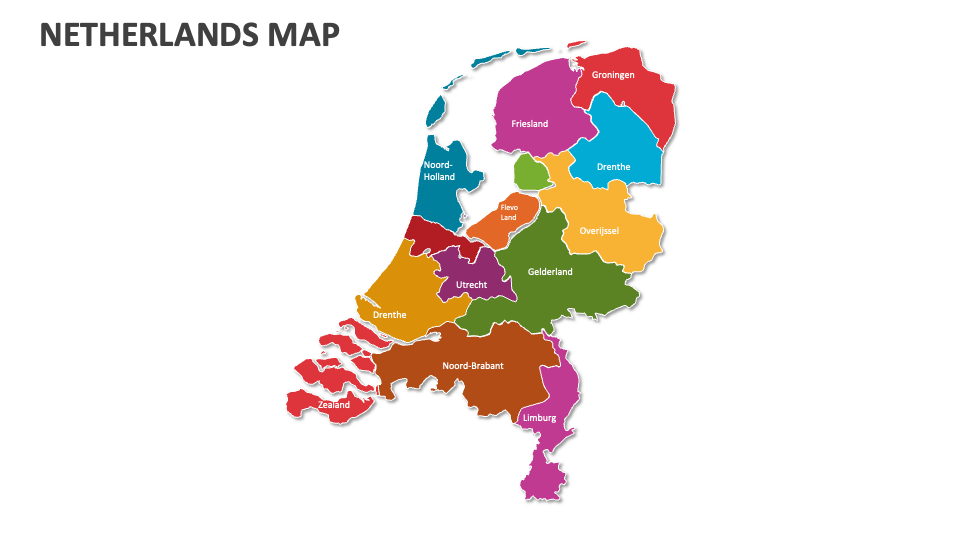
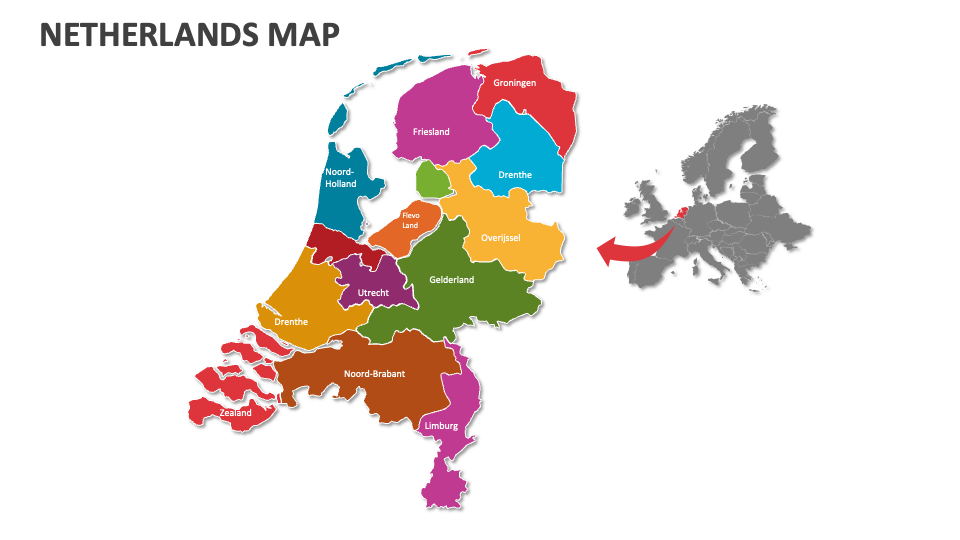
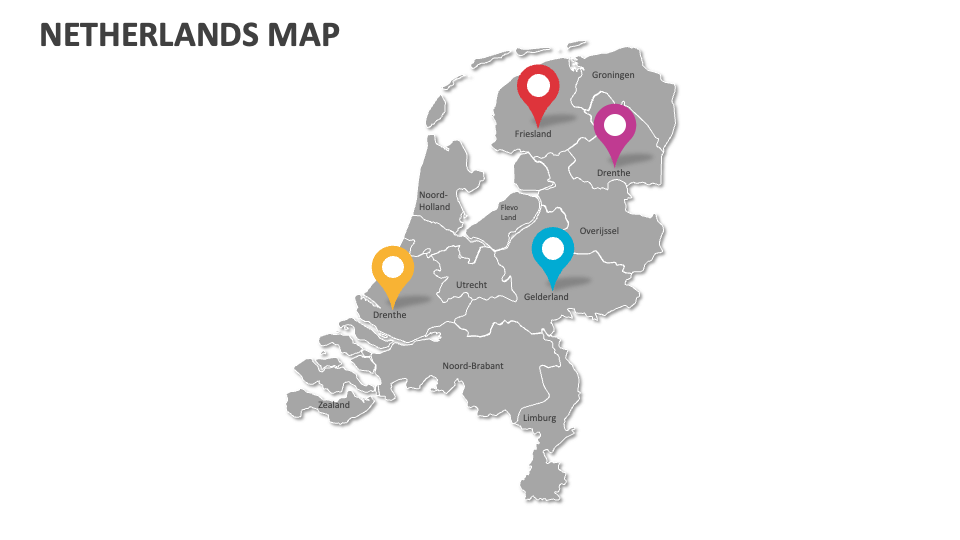
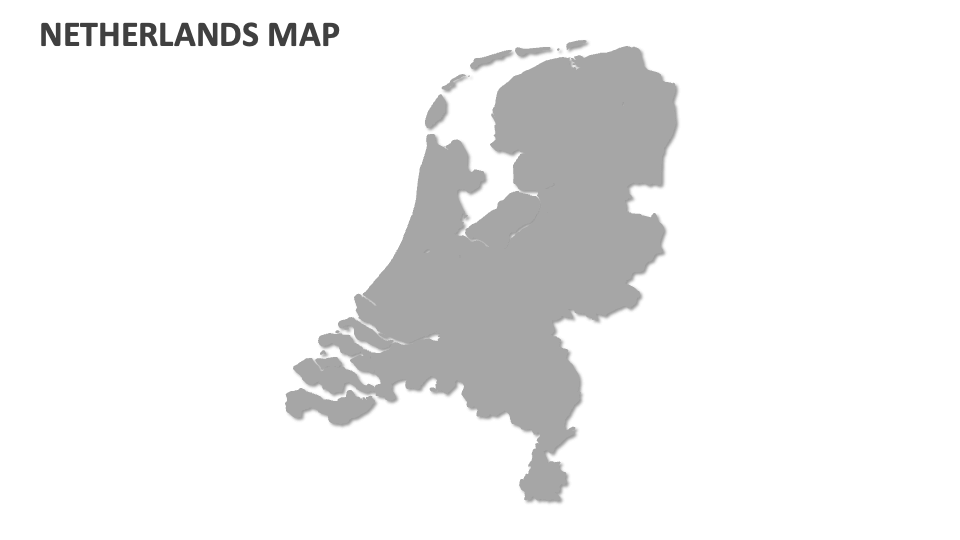
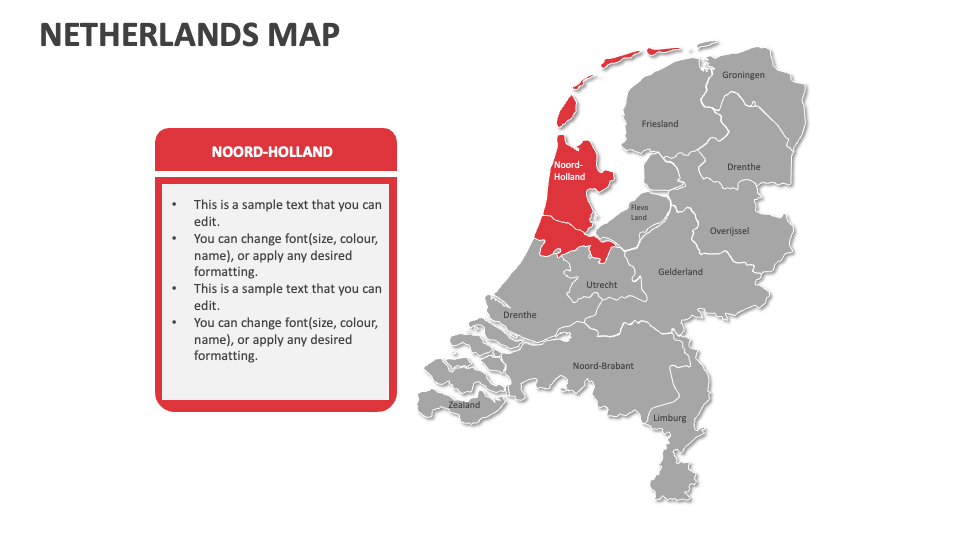
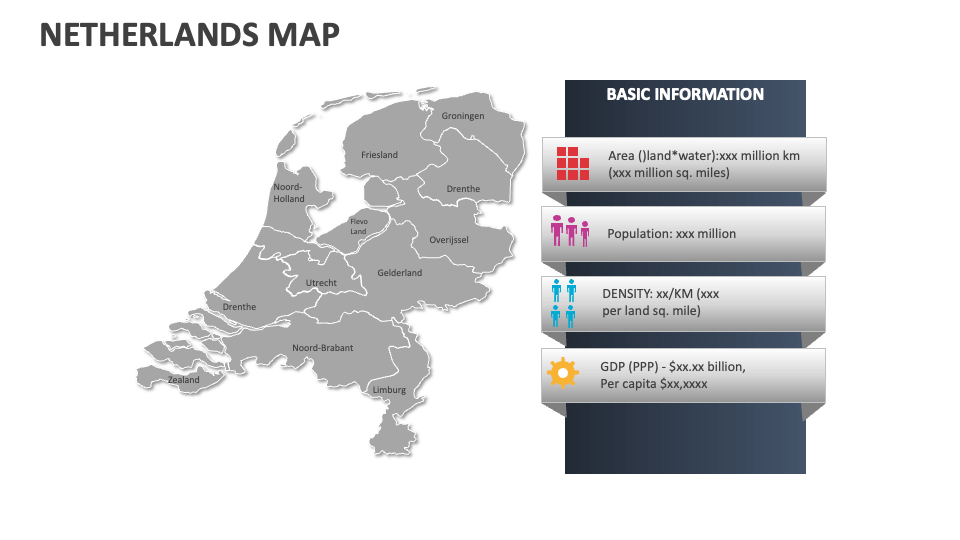
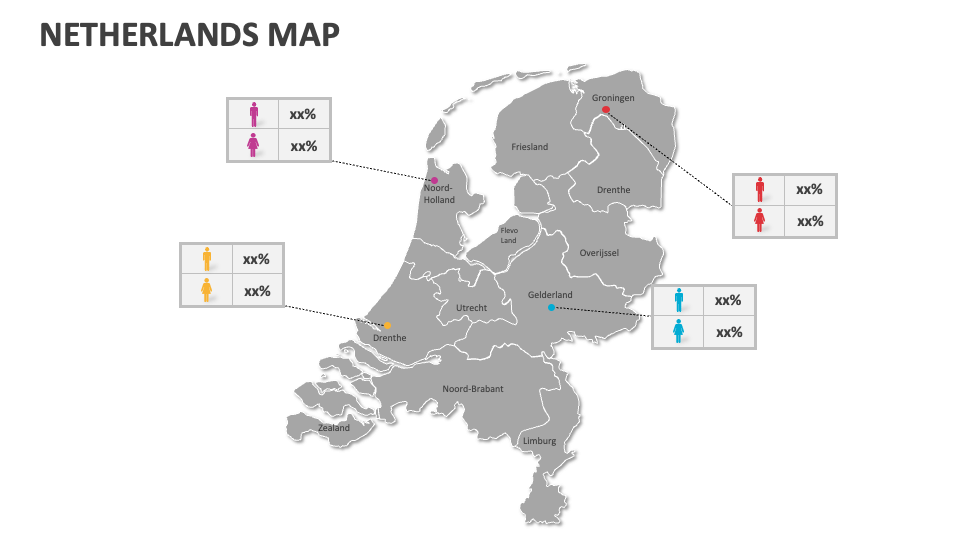
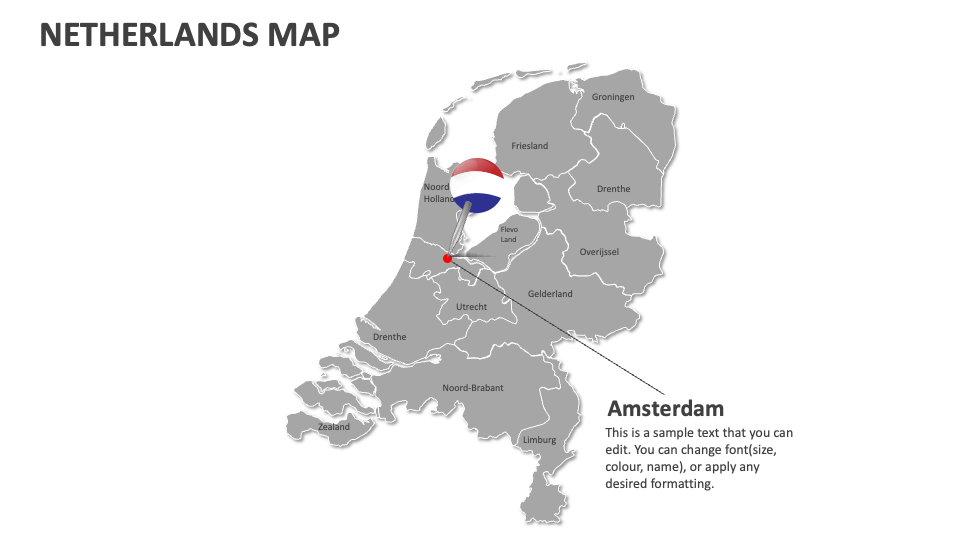
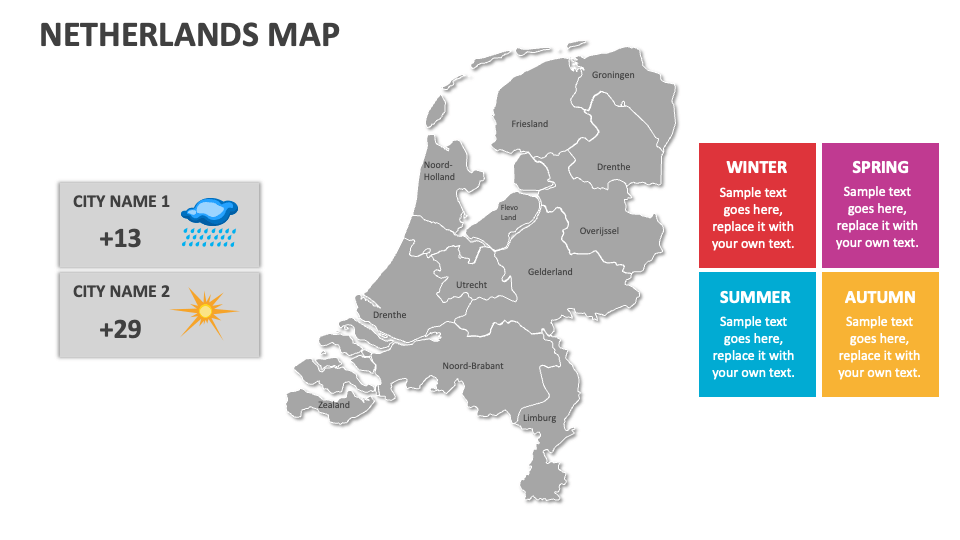
Download our Netherlands Map MS PowerPoint and Google Slides presentation template to present information about the Netherlands’ agricultural zones and crop distributions, region-wise economic indicators, crime statistics, safety levels in different areas, voting patterns, and more.
Business leaders can make the most of this deck to highlight the locations of their business’s headquarters, branches, retail outlets, customer service centers, etc., in the Netherlands. Educators can include these slides in their academic presentations to visualize this country's political structure and governance at national and regional levels. Meteorologists can showcase the average temperature, climatic conditions, and weather patterns in various cities and areas of this European country.