
Result Comparison
In stock
$5.00
item details (5 Editable Slides)
- Applications Supported: PowerPoint, Google Slides
- File Type: .pptx, Google Slides
- Aspect Ratio:16:9 (Wide Screen)
- Animation: Yes
Result Comparison
Result Comparison
(5 Editable Slides)
Related Products


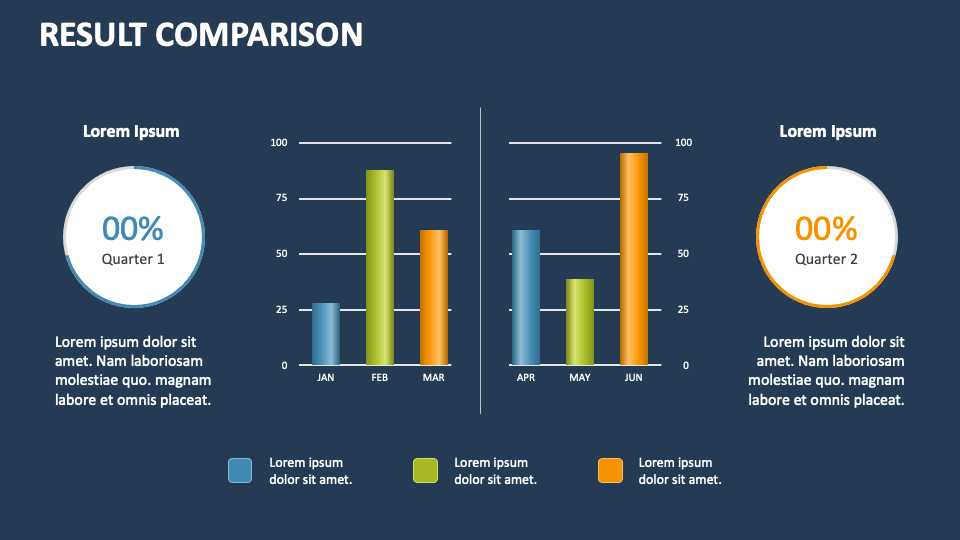
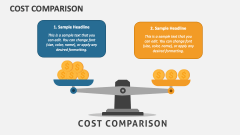
Lay your hands on our Result Comparison presentation template for MS PowerPoint and Google Slides to present a comparative analysis of two or more sets of data, outcomes, or performance metrics to identify similarities, differences, and trends.
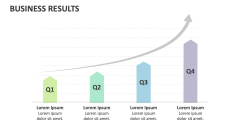
Project managers can capitalize on this incredible set to highlight the differences in project outcomes between two project management approaches. Financial experts can illustrate a company’s financial performance comparison, including metrics like revenue, profit margins, expenses, etc., across different quarters or years. HR heads and team leaders can shed light on the comparative analysis of employee and team performance and achievements based on KPIs like productivity, target achievement, task completion rates, etc. Sales heads can demonstrate the sales figures across regions, timeframes, or product lines.