
Supply Demand Curve
In stock
$5.00
item details (6 Editable Slides)
- Applications Supported: PowerPoint, Google Slides
- File Type: .pptx, Google Slides
- Aspect Ratio:16:9 (Wide Screen)
- Animation: Yes
Supply Demand Curve
Supply Demand Curve
(6 Editable Slides)
Related Products

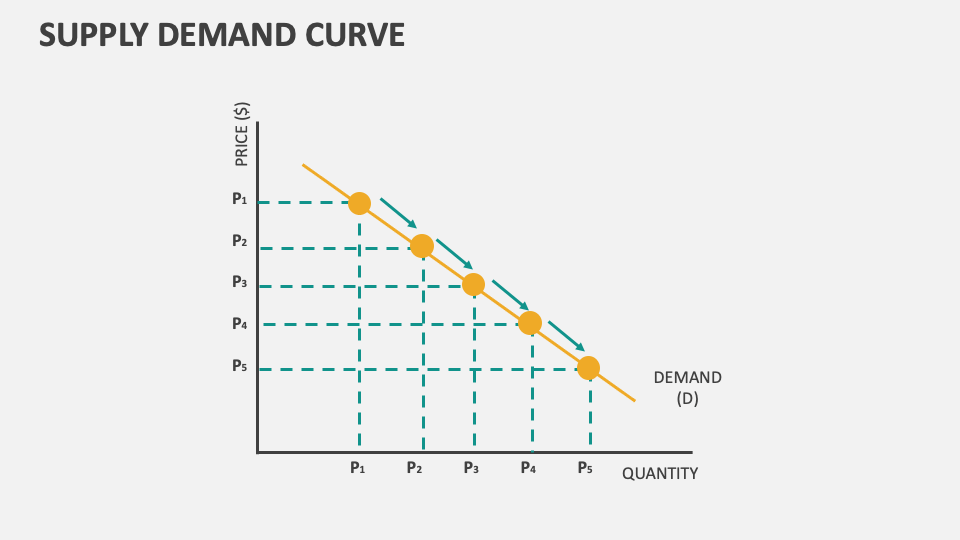
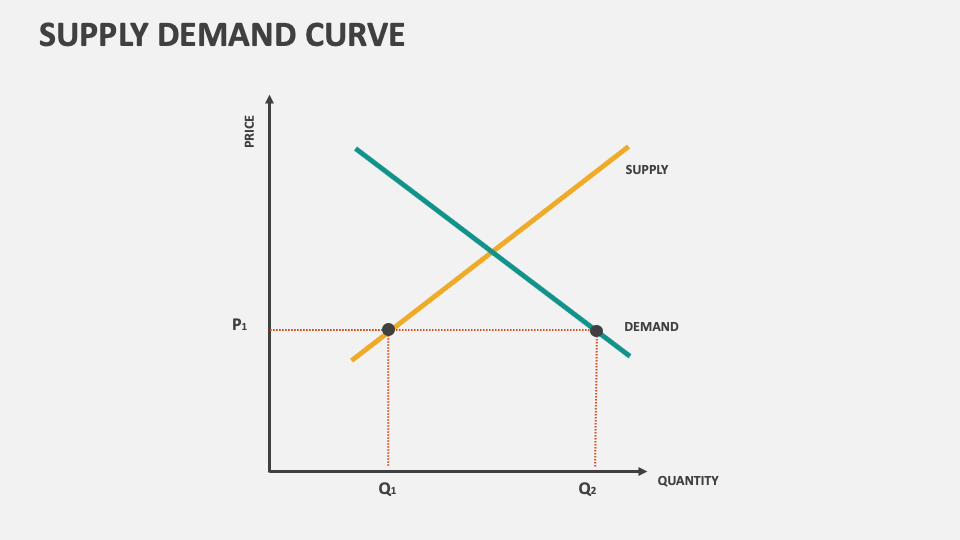
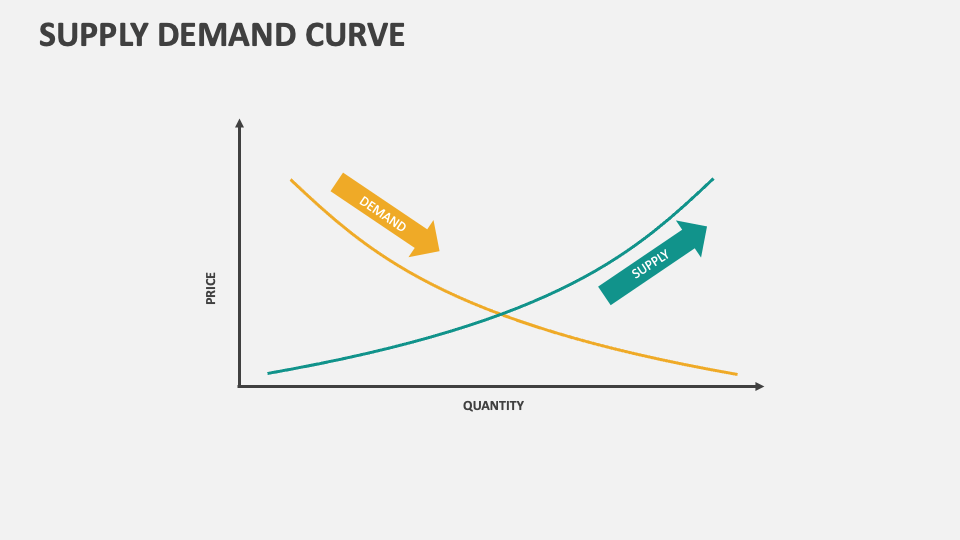
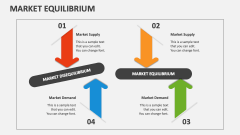
Grab our MS PowerPoint and Google Slides presentation template to describe how the Supply Demand Curve presents the relationship between the quantity of goods/services supplied by producers and the quantity demanded by consumers at different price levels.
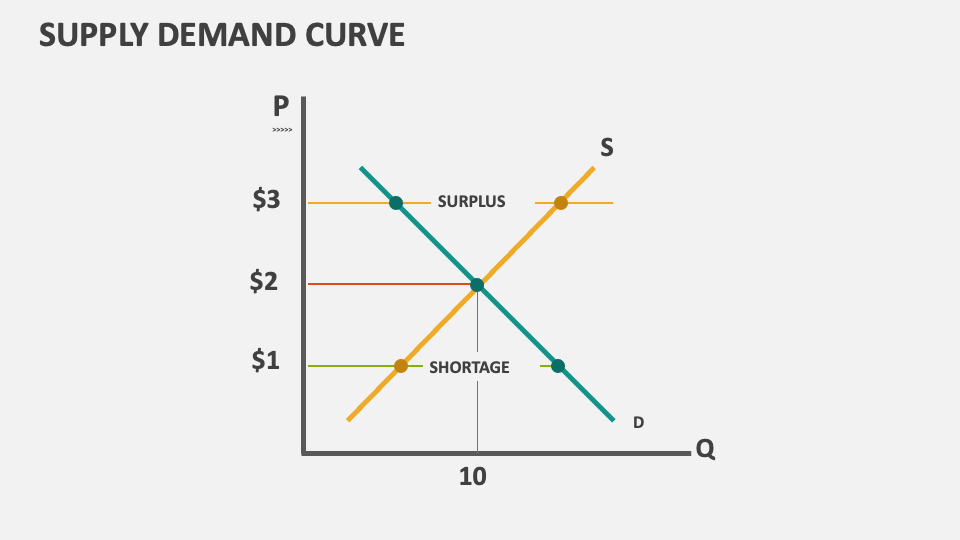
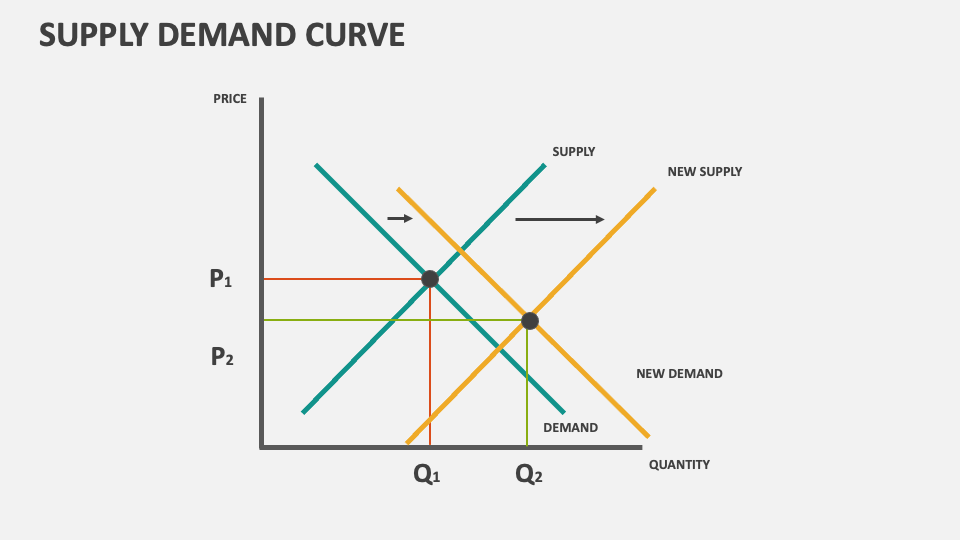
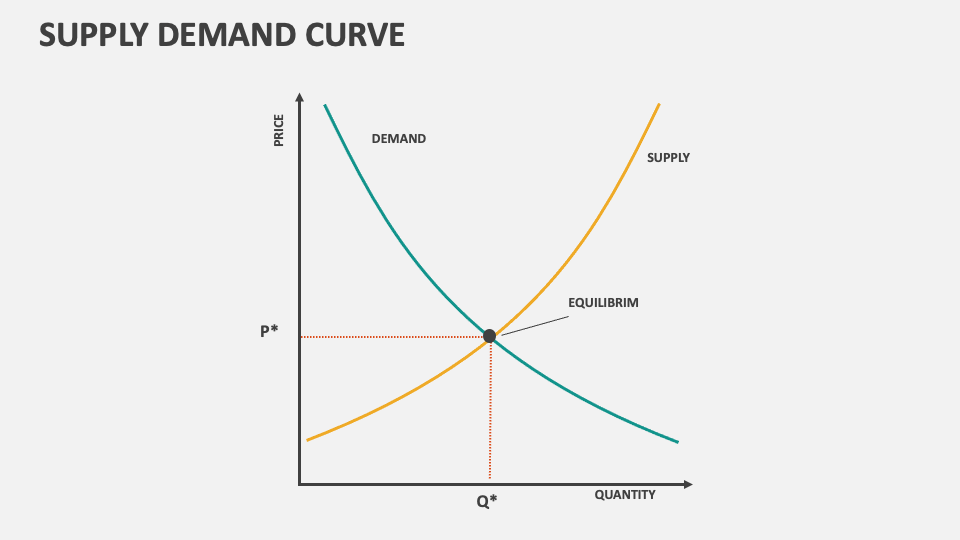
Business leaders, product heads, and market analysts can use this deck to explain how changes in price influence the quantity supplied and demanded in a market. Economists and professors can explain the concepts of consumer and producer surplus and shortage and their relationship to the supply-demand curve. Furthermore, you can shed light on various factors that influence both supply and demand in a market.