
S Curve
In stock
$5.00
item details (8 Editable Slides)
- Applications Supported: PowerPoint, Google Slides
- File Type: .pptx, Google Slides
- Aspect Ratio:16:9 (Wide Screen)
- Animation: Yes
S Curve
S Curve
(8 Editable Slides)

Related Products
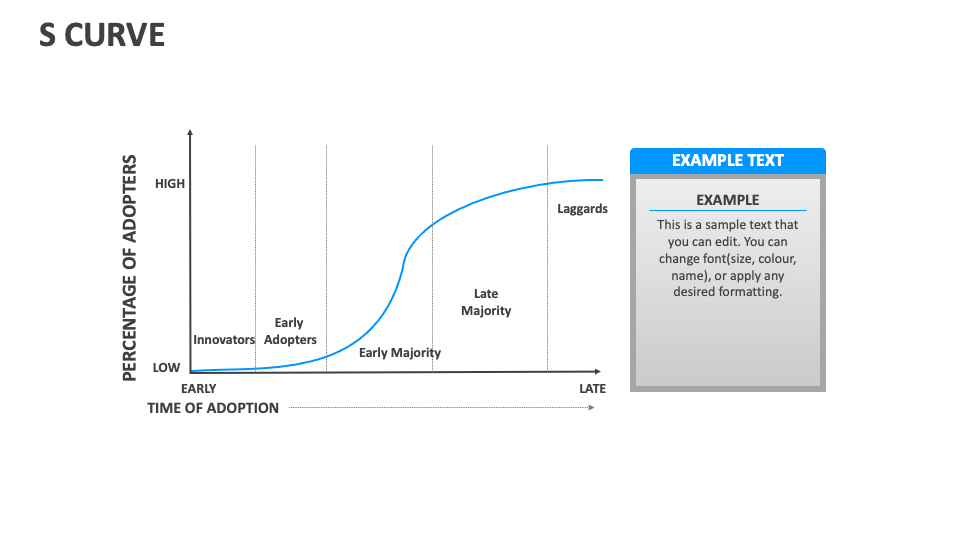
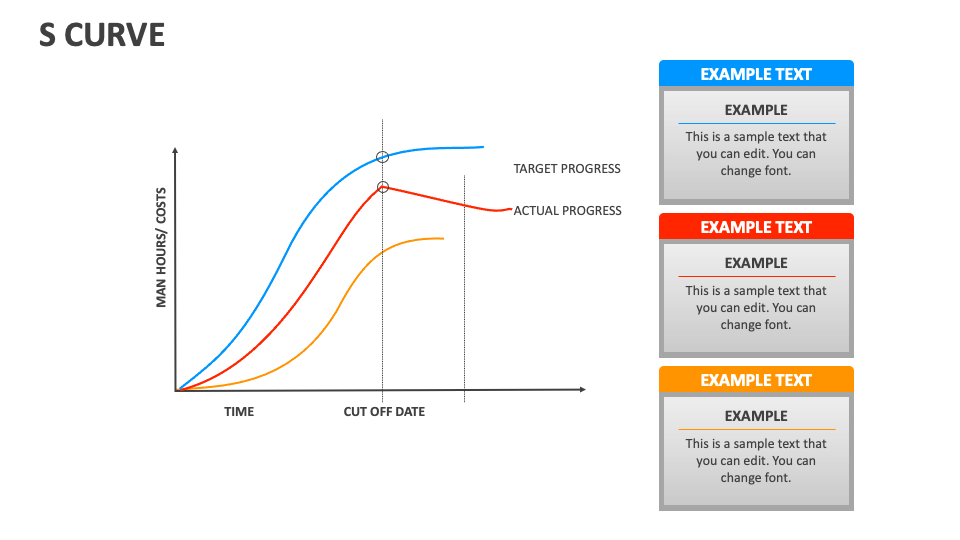
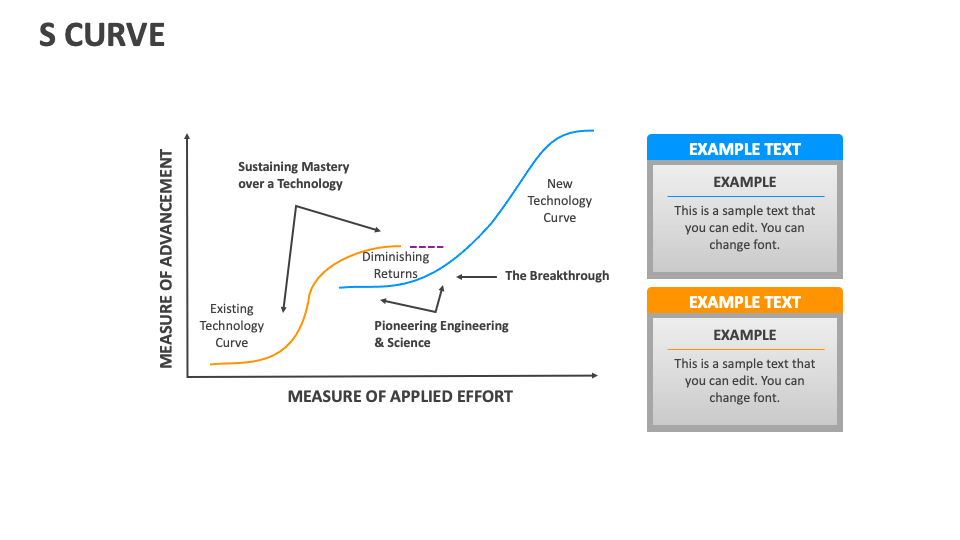
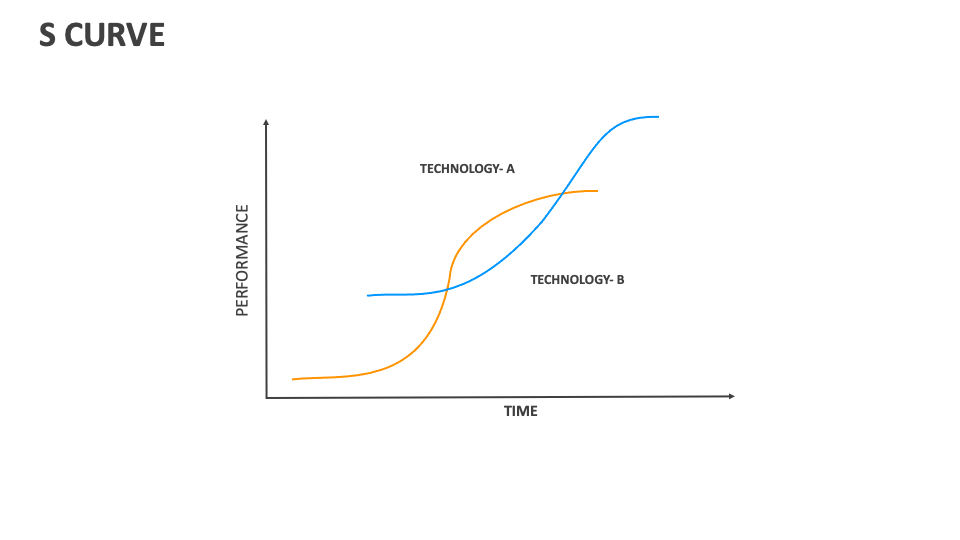
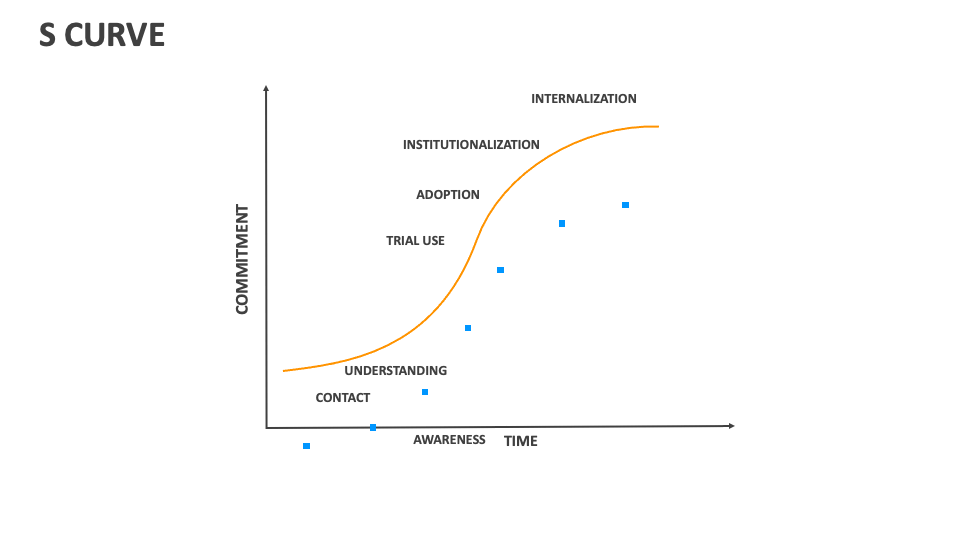
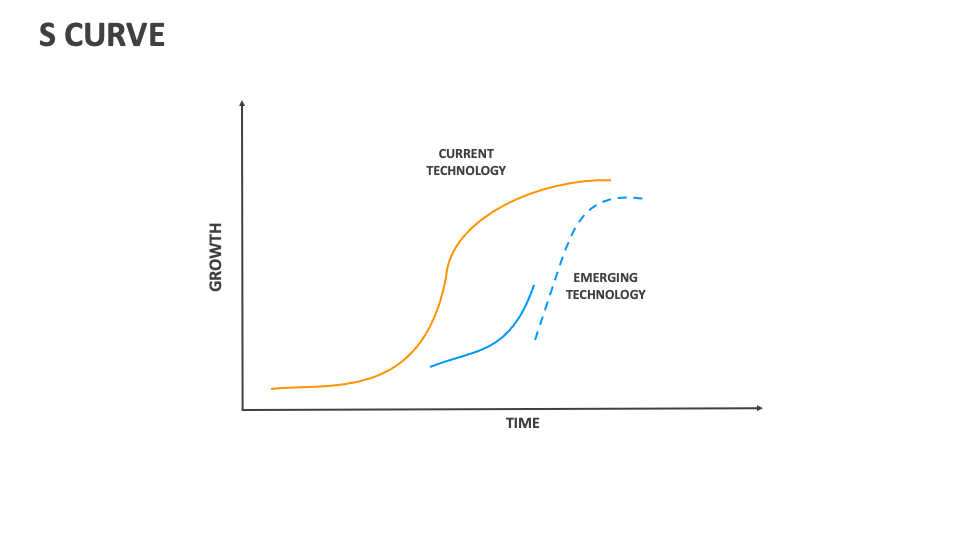
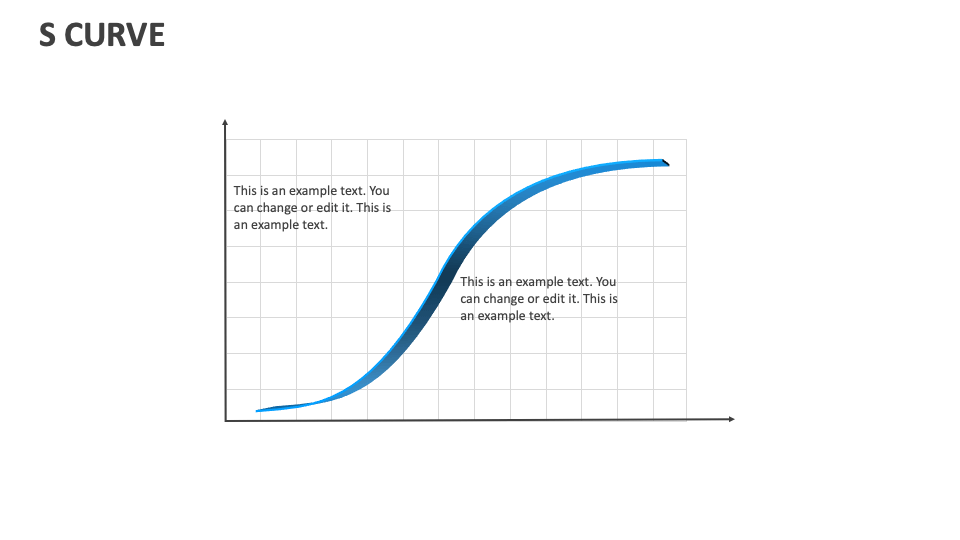
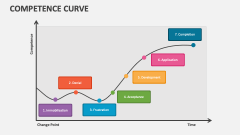
Grab our S Curve MS PowerPoint and Google Slides template to depict the progress of an initiative, project, etc., over time. The deck features high-resolution graphs for visualizing your well-researched data in an understandable manner.
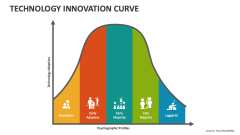
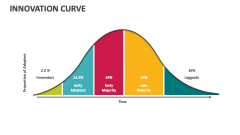
Project heads can capitalize on this 100% customizable PPT to showcase the execution process of their project from the infancy to the maturity phase. Technology/innovation experts and market analysts can shed light on the stages of the technology adoption lifecycle, i.e., innovators, early adopters, early majority, late majority, and laggards. You can further illustrate the adoption rate of technologies or innovations based on the measure of advancement and applied effort.