
Venezuela Map
In stock
$5.00
item details (8 Editable Slides)
- Applications Supported: PowerPoint, Google Slides
- File Type: .pptx, Google Slides
- Aspect Ratio:16:9 (Wide Screen)
- Animation: No
Venezuela Map
Venezuela Map
(8 Editable Slides)
Related Products
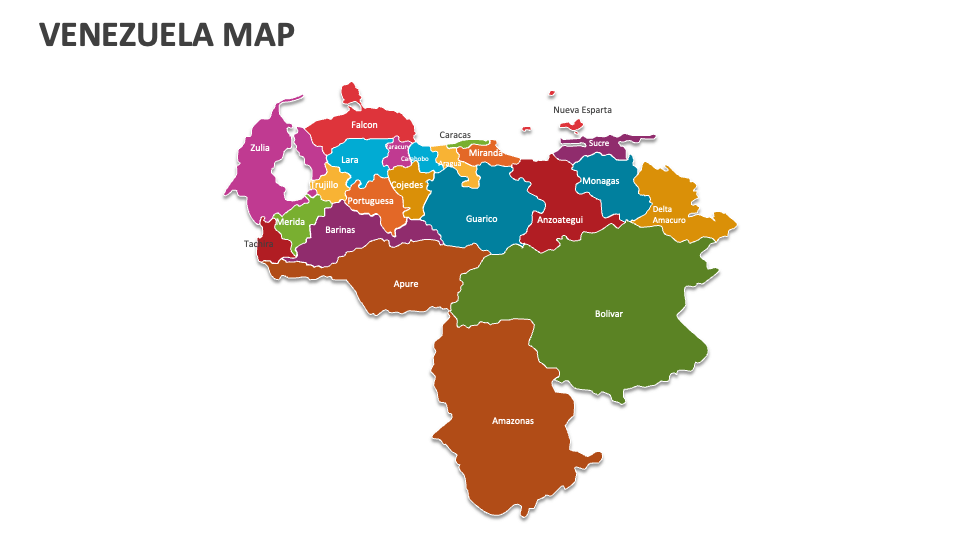
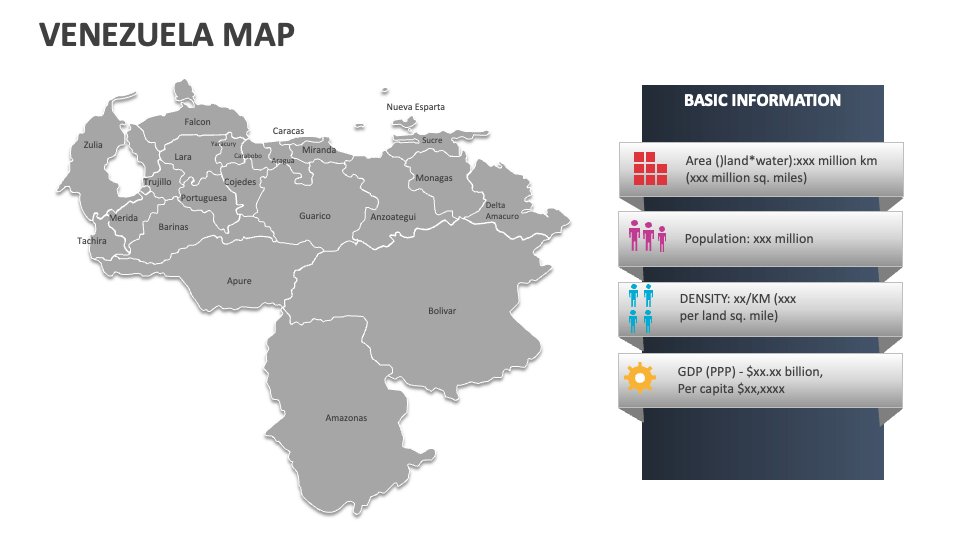
We have come up with the Venezuela Map MS PowerPoint and Google Slides presentation template to help you showcase the mountainous regions, water bodies and ports, locations of prominent petrochemical facilities, areas prone to natural disasters/landslides, national parks, etc., in Venezuela.
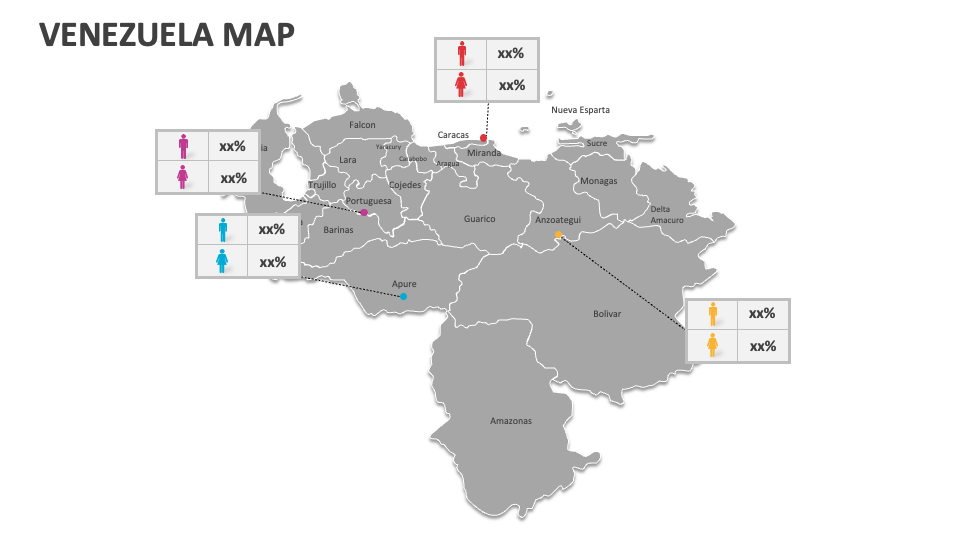
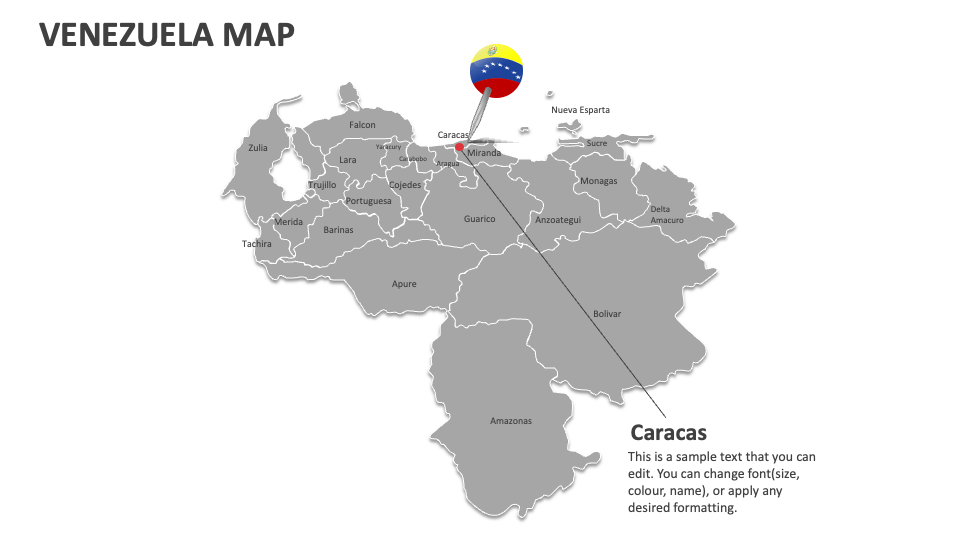
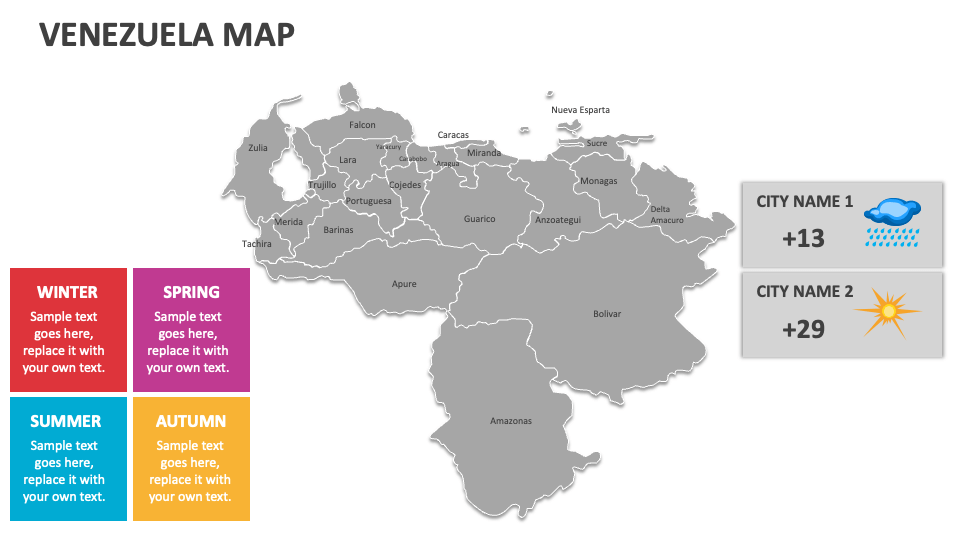
Market analysts can use this feature-rich deck to depict Venezuela's market trends and economic zones. Educators can visualize the urbanization trends and population density across different cities in this South American country. You can highlight the locations of oil fields and production areas, such as the Orinoco Belt, and their significance to Venezuela’s economy and global oil markets. You can include these map illustrations to depict the migration routes and regions most affected by refugee flows.